
Most guides to Six Sigma tools and techniques make the same mistake: they treat the method like a university syllabus. The result is a long catalogue of statistical tests, diagrams, and acronyms, but little help for a plant manager deciding whether today's problem needs a Pareto chart, a fixture change, a control chart, or a full Design of Experiments project.
Manufacturers with limited engineering bandwidth don't need to master every tool. They need a disciplined way to select the smallest toolset that can expose variation, confirm the cause, improve the process, and keep the gain. That approach is especially important in semi-automated and GMP-aware environments, where physical trials can interrupt production and every process change may require careful review.
Table of Contents
- Rethinking the Six Sigma Toolkit for Modern Manufacturing
- High-Frequency Diagnostic Tools for Root Cause Analysis
- Statistical Control and Risk Management Techniques
- Integrating Lean Methodologies for Baseline Stability
- Applying Six Sigma in Semi-Automated and GMP Environments
- Common Pitfalls and the Danger of Overengineering
- Your Actionable Six Sigma Implementation Checklist
Rethinking the Six Sigma Toolkit for Modern Manufacturing
The popular assumption is that a serious Six Sigma program must begin with advanced statistics. On a working production floor, that advice is usually backward. If the team hasn't agreed on the process boundary, confirmed what counts as a defect, or checked whether the measurement system is trustworthy, advanced analysis only gives the plant a more refined way to reach the wrong conclusion.
The practical operating system is DMAIC, Define, Measure, Analyze, Improve, Control. The sequence links the business problem to the production response:
- Define: State the defect, throughput, safety, or cost problem in operational terms.
- Measure: Establish a reliable baseline and define the defect opportunities.
- Analyze: Use evidence to separate likely causes from assumptions.
- Improve: Change the process, equipment, material, method, or controls.
- Control: Monitor the new condition and standardize the work.
The framework is explicit about that order. The DMAIC process and its measurement logic place baseline data in Measure, root-cause analysis in Analyze, implementation in Improve, and ongoing monitoring in Control.
Practical rule: Don't choose the statistical tool before you can describe the process and the failure clearly.
Six Sigma's foundational benchmark gives the improvement effort a common language. A process operating six standard deviations from the nearest specification limit is associated with no more than 3.4 defects per million opportunities, or about 99.9997% defect-free output according to the history and statistical foundation of Six Sigma. The benchmark matters less as a promise that every line must instantly reach it and more as a way to express variation as a measurable performance target.
That target emerged from industrial quality work rather than from an isolated management trend. Motorola introduced the method in 1986 through Bill Smith's work on reducing defects and variability in electronic manufacturing, building on earlier quality-control foundations such as Walter Shewhart's control charts from the 1920s, as documented in the same historical reference. For a manufacturer evaluating production optimization, the lesson is straightforward: measure the process, identify the opportunity for failure, and improve the causes that create variation. Start with the right level of automation and process discipline through manufacturing process optimization, not with an impressive-looking list of formulas.
High-Frequency Diagnostic Tools for Root Cause Analysis
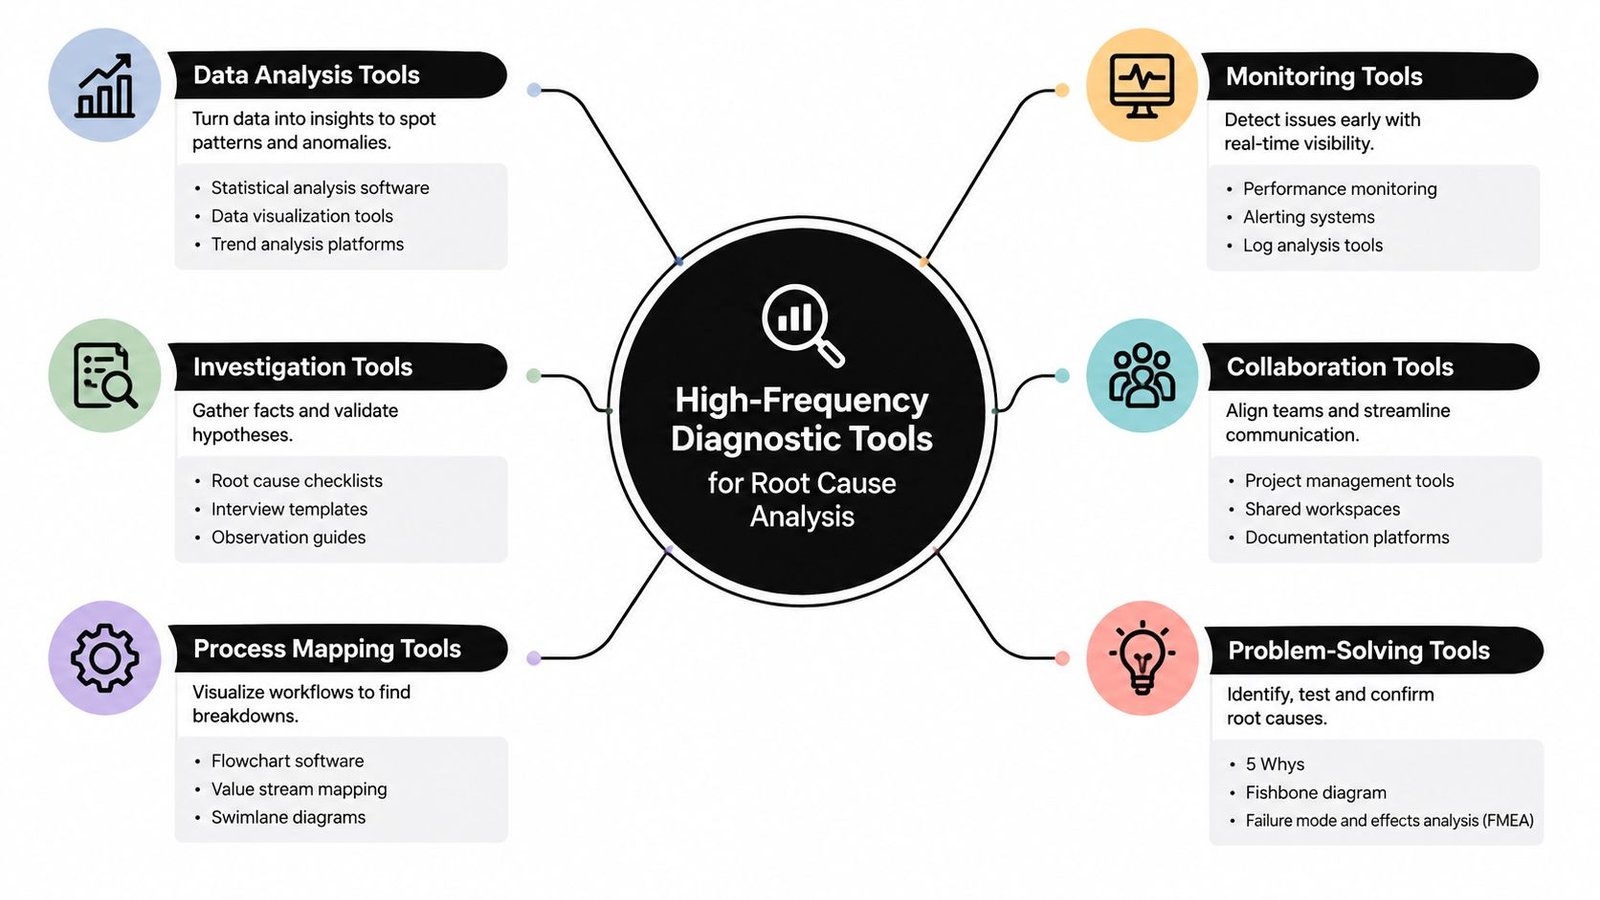
Root-cause work starts with observation. Before calculating capability or testing a hypothesis, the team needs a shared picture of what enters the process, what happens inside it, and what leaves it. Four tools consistently earn their place on the shop floor: SIPOC, process mapping, Pareto analysis, and fishbone diagrams.
Start with the process boundary
Use SIPOC, Suppliers, Inputs, Process, Outputs, Customers, during Define. Keep it high level. List the suppliers that affect the operation, the inputs that can vary, the major process stages, the outputs that matter, and the internal or external customers who receive them.
SIPOC prevents a common failure in improvement projects, where production blames quality, quality blames engineering, and engineering studies a machine that isn't inside the problem boundary. It also exposes missing inputs, such as fixture condition, operator instructions, component orientation, environmental conditions, or inspection method.
Detailed process mapping follows. Walk the line and record the actual sequence, not the intended sequence in a work instruction. Include handoffs, queues, rechecks, adjustments, material presentation, machine stops, and decisions made by operators. In a semi-automated assembly station, the map should show where the operator loads a part, where a sensor confirms position, where the fixture clamps, where the system applies force or motion, and where the result is accepted or rejected.
Turn observations into priorities
A Pareto chart ranks defect categories, downtime causes, or rework reasons so the team can focus on the most consequential contributors first. It doesn't prove causation. It does prevent an engineering group from spending a week on a rare defect while a recurring alignment issue fills the scrap bin.
A useful Pareto starts with clean categories. “Operator error” is usually too broad to guide action. Separate incorrect loading, missed inspection, wrong component orientation, and response to an unclear alarm. The chart then points the team toward a specific process condition that can be investigated.
The fishbone diagram, or Ishikawa diagram, helps the team expand that investigation across categories such as machine, material, method, measurement, environment, and people. Its value depends on how the team uses it. Don't stop at “operator error.” Ask why the operator could load the part incorrectly. Was the nest symmetrical? Could the sensor detect partial seating? Did the work instruction show the correct orientation? Did incoming material vary in a way the fixture couldn't accommodate?
Pair each suspected cause with an observation or data collection plan. A machine-monitoring approach such as production equipment monitoring can help connect alarms, cycle behavior, and stoppage patterns to the physical process, but the data still needs to be interpreted against what operators and engineers see at the station.
Statistical Control and Risk Management Techniques
Diagnostic tools tell the team where to look. Statistical control and risk tools determine whether the process is stable, capable, and safe to change. These methods carry more analytical weight, so the team should apply them after confirming the measurement system and defining the process response that matters.
Control variation before chasing capability
A control chart separates ordinary process noise from special-cause variation. A stable chart doesn't mean the process meets specification. It means the process is behaving consistently enough for capability analysis to be meaningful. A drifting temperature, intermittent sensor fault, tool wear pattern, or shift-related change calls for a different response than natural variation around a stable center.
Process capability metrics then compare the process distribution with specification limits. Cp and Pp focus on spread, while Cpk and Ppk also account for how centered the process is relative to the limits. The practical distinction matters when a new fixture appears consistent but is running too close to one specification boundary.
| Metric | Focus | Best Used For |
|---|---|---|
| Cp | Potential capability based on process spread | Checking spread when centering is already understood |
| Cpk | Capability adjusted for process centering | Evaluating whether a stable station fits specification limits |
| Pp | Overall performance spread across observed data | Reviewing broader or longer-term process performance |
| Ppk | Overall performance adjusted for centering | Assessing actual performance when shifts and drift are present |
The Six Sigma capability guidance identifies control charts as useful across Measure, Analyze, and Control, and describes Cp and Cpk as practical calculations for assessing process capability. For a semi-automated fixture, don't release the equipment based on a handful of acceptable parts. Confirm that the measurement method is repeatable, the process is stable, and the capability result reflects the intended operating window.
Use FMEA and DOE for different decisions
Failure Mode and Effects Analysis, or FMEA, is a forward-looking risk tool. In GMP-aware production, it helps a cross-functional team consider how a failure could occur, what effect it could have, how it might be detected, and what preventive control belongs in the process. FMEA shouldn't become a document-writing exercise. Link each meaningful risk to a design feature, poka-yoke, inspection, alarm, maintenance action, or process control.
Design of Experiments, or DOE, is appropriate when multiple factors interact and one-variable-at-a-time trials won't reveal the operating window. Use it to evaluate factors such as force, dwell, temperature, alignment, or feed conditions in a controlled plan. The trade-off is real: DOE demands sound measurement, carefully selected factors, and disciplined execution. It can reduce blind trial-and-error, but it isn't justified for every loose fastener or obvious sensor fault.
Before changing equipment or process parameters, an automation risk assessment can help define hazards, failure modes, validation concerns, and the controls needed to make the improvement defensible.
Integrating Lean Methodologies for Baseline Stability
Six Sigma can reduce variation, but it can't make a wasteful process efficient. A team that applies SPC to a workstation with misplaced tools, inconsistent material presentation, excessive walking, and unclear handoffs is measuring instability without removing the conditions that create it.
Value Stream Mapping provides the wider view. Map material and information flow from release through completion, then identify queues, bottlenecks, rework loops, and non-value-added movement. The purpose isn't to produce a decorative wall chart. It is to decide where the constraint sits and which process step deserves deeper Six Sigma analysis.
Stabilize the workplace before collecting conclusions
5S, Sort, Set in order, Shine, Standardize, Sustain, gives operators a visual way to recognize abnormal conditions. Tools have defined locations, materials have clear presentation points, cleaning becomes part of normal work, and standards describe the expected condition. That foundation makes the Control phase more practical because operators can see when a fixture, gauge, or component is out of place.
Kaizen adds a different mechanism. It encourages the people closest to the work to make focused, incremental improvements rather than waiting for a large engineering project. In a small or mid-sized plant, that can be more effective than reserving every improvement for a specialist team.
A clean workstation won't solve a tolerance problem, but a tolerance study won't solve a workstation that creates avoidable motion and confusion.
The right sequence is often Lean first, Six Sigma second. Use VSM to locate the constraint, 5S to make the work condition visible, and Kaizen to remove straightforward friction. Then apply Pareto analysis, measurement-system checks, SPC, capability analysis, or DOE to the remaining critical process.
This combination also protects engineering capacity. Teams shouldn't build a complex statistical model to explain delays caused by poor line balance or a missing tool. First create a stable baseline. Then use Six Sigma to control the variation that remains.
Applying Six Sigma in Semi-Automated and GMP Environments
Semi-automated manufacturing sits between two familiar models. The operator still influences loading, orientation, inspection, and response to alarms, while fixtures, sensors, controls, and software determine whether the process is repeatable. A successful project must account for both sides of that interaction.
Make the data trustworthy before making it clever
Begin with exploratory data analysis. Review distributions, time order, outliers, missing values, stratification by operator or material lot, and relationships between process inputs and outputs. The ISO 24481-1:2026 reference on exploratory data analysis specifically cautions against modeling before the data has been understood and visualized.
That principle is particularly useful in regulated production. A model built from mixed shifts, unverified measurements, or changing material conditions may look precise while hiding the process behavior. Establish data definitions, traceability, measurement method, and change-control expectations before using the result to justify a production change.
Digital twins and simulation can support DOE preparation when physical trials are expensive or disruptive. They don't replace validation or live process evidence. They can help screen factor combinations, identify implausible settings, and narrow the physical experiment to conditions worth evaluating. Recent quality guidance describes DOE as the gold standard for controlled experimentation while recognizing simulation and digital twins as tools for pre-screening factors.
Calculate DPMO against real opportunities
DPMO is useful when one unit has multiple ways to fail. The formula is:
DPMO = defects ÷ total opportunities × 1,000,000
The DPMO process-sigma explanation explains why the denominator must include every defined opportunity across the units inspected. If an assembly has several distinct inspection points, the team must define those opportunities consistently before comparing performance across lines or periods.
The common Six Sigma conversion includes a 1.5-sigma shift convention, which is why the familiar six-sigma benchmark is expressed as 3.4 DPMO rather than literal zero defects, as noted in the same source. The convention doesn't remove the need for precise defect definitions. It makes the measurement comparable only when teams count opportunities the same way.
For GMP-aware operations, connect the DPMO calculation to the risk file, inspection records, nonconformance system, and approved process definition. Don't create a separate improvement metric that conflicts with quality-system terminology. The best tool is the one production, quality, and engineering can interpret consistently without weakening traceability.
Common Pitfalls and the Danger of Overengineering
The fastest way to damage a continuous-improvement culture is to make operators participate in analysis that has no clear connection to the work. A simple loading defect doesn't need regression analysis if direct observation shows that the nest accepts two orientations. A recurring sensor failure doesn't need a complex model if maintenance records and alarm history point to a loose connection.
The opposite mistake is also common. Teams jump to a solution before defining the defect, verifying the measurement system, or checking whether the apparent cause changes with material, shift, tool, or machine condition. Both extremes waste time. One overcomplicates a simple problem, while the other installs an unverified fix.
Match the tool to the problem
| Problem condition | Start with | Escalate to |
|---|---|---|
| Process boundary is unclear | SIPOC and process mapping | Cross-functional analysis |
| Defect categories are known but unfocused | Pareto chart | Stratification and root-cause study |
| Suspected causes are broad | Fishbone and direct observation | Hypothesis testing or regression |
| Measurement results are inconsistent | MSA and Gage R&R | Improved gauge, method, or fixture |
| Process behavior changes over time | Control chart | Special-cause investigation |
| Stable process misses specification | Capability analysis | Centering, redesign, or DOE |
| Multiple factors interact | DOE planning | Simulation or controlled physical trials |
Measurement System Analysis, including Gage R&R where appropriate, belongs before serious baseline interpretation. If inspectors or instruments disagree, the team may mistake measurement noise for process variation. That leads to incorrect adjustments, unnecessary automation changes, and weak control limits.
Use the least complex tool that can answer the decision in front of you.
A Pareto chart and a better fixture may solve a problem that a statistical package only describes. Conversely, a recurring interaction between several machine settings may justify DOE after simpler checks are complete. Tool maturity should follow process maturity, data quality, risk, and decision consequence, not the certification level of the analyst.
Your Actionable Six Sigma Implementation Checklist
A first project should be narrow enough to manage and important enough to matter. Choose one defect family, bottleneck, changeover issue, or equipment-performance problem. Write the operational impact in terms the team can observe, then assign a process owner who can make decisions across production, quality, maintenance, and engineering.
Define and Measure
- Write the charter: State the problem, process boundary, customer requirement, owner, and expected decision.
- Define the defect: Describe what passes, what fails, and how the team will count an opportunity.
- Map the current state: Use SIPOC for scope, then document the actual work sequence at the station.
- Validate the measurement system: Check the gauge, inspection method, data capture, and operator interpretation before trusting the baseline.
- Collect stratified data: Separate relevant conditions such as machine, shift, material, tool, and product configuration instead of blending them into one average.
Analyze and Improve
- Prioritize the response: Use a Pareto chart to select the defect or delay worth solving first.
- Test the physical story: Use a fishbone diagram, direct observation, and targeted checks to confirm or reject suspected causes.
- Assess risk: Update FMEA when the proposed change affects tooling, controls, inspection, material flow, or operator interaction.
- Select the lightest effective change: Try mistake-proofing, fixture redesign, visual controls, standard work, or parameter limits before reaching for complex modeling.
- Use DOE deliberately: Apply controlled experiments when factors interact and simulation can help screen conditions before disrupting the validated line.
- Secure operator buy-in: Have operators evaluate loading, access, alarms, cleaning, ergonomics, and recovery steps before the change becomes permanent.
Control and Sustain
- Confirm the new baseline: Verify that the improvement produces the intended result under normal operating conditions.
- Use the right chart: Select a control chart that fits the data type, sampling pattern, and production decision.
- Automate alerts carefully: Configure control-chart or machine-monitoring alerts so the responsible person receives an actionable signal, not a stream of noise.
- Standardize the work: Update instructions, training, maintenance requirements, inspection records, and control plans.
- Audit the condition: Review the process after implementation and investigate drift before the old failure mode returns.
The most effective Six Sigma tools and techniques are rarely the most complicated. They are the tools that help a production team define the problem accurately, see the process as it runs, verify the cause, make a controlled improvement, and maintain the result without creating unnecessary administrative work.
If your plant needs to reduce variation, improve a manual workstation, or develop a GMP-aware semi-automated system, visit System Engineering & Automation. Their team provides custom tooling, fixtures, integrated controls, and end-to-end engineering support to match the improvement opportunity to your production goals and budget.