Repeated stoppages, slow changeovers, operator workarounds, and poorly supported equipment can erode output even while the machinery remains mechanically sound. That's why downtime reduction strategies should start with measurement and immediate problem-solving, not with an expensive technology rollout. Research summaries report that predictive maintenance programs commonly reduce unplanned downtime by 30% to 50%, with some manufacturing findings also reporting lower maintenance costs and higher uptime when teams anticipate failures early (predictive maintenance findings in manufacturing).
Manufacturers can begin with quick wins, such as reliable downtime coding, root cause analysis, standard work, and better spare-parts readiness. From there, preventive and predictive maintenance, OEE improvements, custom tooling, faster changeovers, semi-automation, and resilience engineering can be matched to the losses that matter.
For manufacturers in Southeast Asia, the practical choice isn't always a fully automated plant. A targeted fixture, upgraded control system, semi-automatic workstation, commissioning program, or responsive maintenance service may solve the constraint more effectively. System Engineering & Automation, or SEA, supports production and service optimization through custom tooling, fixtures, controls, semi-automatic systems, installation, commissioning, maintenance, and ongoing support.
Table of Contents
- 1. Performance Monitoring and OEE Tracking
- 2. Root Cause Analysis and Problem-Solving
- 3. Preventive and Predictive Maintenance
- 4. Quick Changeover and Setup Reduction
- 5. Operator Training and Competency Development
- 6. Total Productive Maintenance
- 7. Tooling, Fixturing, and Semi-Automation Upgrades
- 8. Spare Parts Inventory Management and Supply Chain Optimization
- 9. Equipment Redundancy and Fault Tolerance Design
- Downtime Reduction: 9-Strategy Comparison
- Turn Downtime Data Into the Next Upgrade
1. Performance Monitoring and OEE Tracking
Downtime reduction starts with trustworthy production data. Overall equipment effectiveness, or OEE, combines Availability, Performance, and Quality, giving operations teams a common way to separate lost runtime from slow cycles and defective output. The formula is OEE = Availability × Performance × Quality, making availability the direct measurement of downtime within the broader production picture (OEE production monitoring guidance).
A medical device assembly line might discover that availability losses cluster around fixture changeovers rather than equipment breakdowns. A pharmaceutical filling operation may see quality losses connected to sensor drift. A contract manufacturer can compare OEE across its lines and decide where maintenance engineering deserves attention first, instead of distributing resources evenly.
Start narrowly. Select two or three critical assets, capture run, idle, and down states, and make operators' reason codes specific to the equipment. Useful categories include scheduled maintenance, equipment failure, changeover, material shortage, quality stop, and process adjustment. If every stoppage is recorded as “machine problem,” the data won't support a useful corrective action.
Build a baseline before changing the process
Establish a baseline over four weeks before launching an improvement initiative. That period gives the team a clearer view of recurring losses than a single shift or unusually strong production day. Production counts must also distinguish good parts from scrap, and automated collection is preferable where signals are available.
A semi-automated packaging system may show performance loss after commissioning because servo settings or cycle parameters need refinement. Shift-level visibility may reveal that the night shift needs additional training or escalation support. The dashboard matters less than the conversation it creates at the point of production.
Practical rule: Don't average away the problem. Rank losses by equipment, cause, shift, and duration, then attack the most repeatable pattern first.
For a focused approach to live state monitoring, downtime logging, and production visibility, manufacturers can review SEA's production monitoring systems. Use OEE to validate improvements after commissioning, compare before and after results, and inform upgrade or replacement decisions. Industry guidance often describes 80% to 90% OEE as world-class and an OEE below 60% as a substantial improvement opportunity, but those figures should be treated as directional benchmarks rather than universal targets (OEE improvement guidance).

2. Root Cause Analysis and Problem-Solving
Replacing the same servo motor repeatedly doesn't solve a packaging line fault if a misaligned sensor is causing the motor to work outside its intended conditions. Root cause analysis, or RCA, forces the team to distinguish the visible symptom from the mechanism that creates it.
The strongest RCA process brings together operators, maintenance technicians, engineers, quality personnel, and supervisors. Operators often know the sequence that precedes a stop. Technicians understand the failure mechanism. Quality staff can identify whether the same condition creates batch or product risk. Engineering can determine whether the equipment, tooling, controls, or process needs redesign.
Make the investigation specific
Use 5-Why analysis, a Fishbone diagram, and FMEA where appropriate. Five questions may not be enough. Continue until the team reaches a cause it can control, verify, and prevent from recurring. A medical device manufacturer might trace repeated assembly stoppages to an undersized hydraulic line. An automotive supplier can use FMEA during fixture design to identify failure modes before tooling reaches the floor.
Conduct significant investigations while operating conditions and operator observations are still fresh. A structured review should identify:
- Primary cause: The condition that directly created the failure.
- Contributing factors: Conditions that increased the likelihood or impact.
- Corrective action: The change that removes or controls the cause.
- Verification method: The evidence that confirms the action worked.
- Owner and due date: The person accountable for implementation.
A pharmaceutical facility investigating batch failures may find inadequate cleaning procedures rather than a mechanical fault. That distinction changes the corrective action, documentation, training, and validation requirements.
Document findings in a searchable system and connect them to the affected asset, tooling, process, and failure mode. A useful RCA record should also compare possible corrective actions by cost, implementation time, safety, quality impact, and engineering support required. SEA's failure mode analysis service can support manufacturers that need failure modes considered during equipment or tooling development, not only after a breakdown.
The test of RCA is recurrence. If the same issue returns, the team either misidentified the cause, implemented an incomplete corrective action, or failed to verify that the new condition was sustained.
3. Preventive and Predictive Maintenance
Preventive maintenance and predictive maintenance solve different problems. PM creates disciplined inspections, lubrication, calibration, adjustments, and planned replacements based on time, usage, or production cycles. PdM uses condition signals, such as vibration, temperature, oil, acoustic readings, current draw, or cycle counts, to identify deterioration before failure.
A hybrid program usually fits semi-automated and automated equipment better than an either-or approach. A medical device manufacturer may retain scheduled calibration for precision equipment while monitoring critical motors for abnormal vibration. A packaging line can combine routine lubrication with condition monitoring on bearings and servo assemblies. PM protects known requirements. PdM helps the team avoid servicing healthy equipment too early or discovering deterioration too late.
Match maintenance effort to criticality
Start with equipment where a failure would disrupt a bottleneck, compromise quality, create a safety concern, or require a long replacement lead time. Manufacturer recommendations provide a baseline, but operating conditions should refine the schedule. Heat, dust, washdown, high cycling, product residue, and shift patterns can change how quickly components deteriorate.
A CMMS can track work orders, maintenance history, parts, inspections, and sensor alerts. However, an alert must lead to an actionable response. SEA's digital twin and predictive maintenance solutions can help connect equipment condition information with engineering and maintenance decisions.
A sensor that produces alerts without a defined inspection, owner, severity level, and work-order path adds noise rather than reliability.
Set baseline performance data during the first 60 to 90 days of operation when implementing monitoring on a new or upgraded system. Those figures are practical commissioning guidance, not a universal failure threshold. Train operators to report changes in noise, vibration, heat, smell, cycle behavior, or product quality, then define which conditions require immediate intervention and which can be planned into the next maintenance window.
Too much PM can also create downtime. Excessive calendar-based work consumes labor, creates backlog, and may introduce maintenance errors without addressing the failure mechanism. Adjust schedules using equipment usage, failure history, MTBF trends, and condition evidence. The goal is planned intervention at the right time, not the highest number of maintenance tasks.
4. Quick Changeover and Setup Reduction
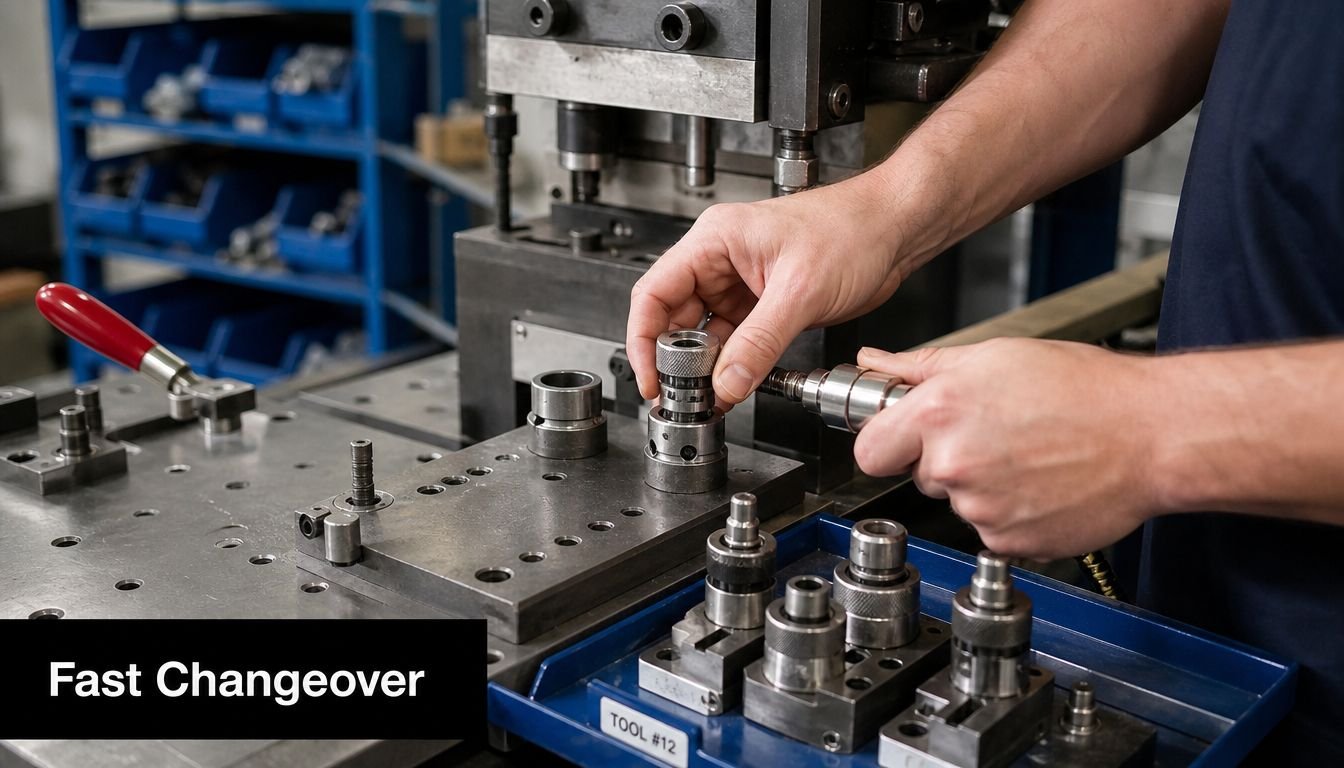
Changeover downtime often hides behind the assumption that the machine must be stopped for every setup task. SMED, or Single-Minute Exchange of Die, challenges that assumption by separating internal activities, which require the machine to be stopped, from external activities, which can happen while it's running.
A custom assembly operation can pre-stage component kits, fixtures, tools, and verified settings before the final part leaves the current run. Quick-disconnect pneumatic and electrical interfaces can remove repeated reconnection work. Standardized mounting surfaces can reduce re-measurement and adjustment. These changes also make smaller batches more practical when customer demand or product mix requires flexibility.
Design the setup around repeatability
Begin with a time-motion study. Record every activity from the last good part to the first acceptable part of the next run. Note waiting, searching, adjustment, inspection, cleaning, transport, and communication. The first engineering target should be stopped-machine work, because every minute removed from internal setup returns production time directly.
Useful design choices include:
- Quick coupling: Standardize pneumatic, hydraulic, and electrical connections where safe and appropriate.
- Modular fixturing: Use repeatable interfaces so fixtures locate without lengthy adjustment.
- Pre-staging: Prepare tools, materials, recipes, and documentation during the current production run.
- Parallel work: Assign separate setup tasks to trained personnel rather than performing them sequentially.
- Visual standards: Show the correct sequence, settings, tools, and acceptance checks at the workstation.
A pharmaceutical packaging line may use parallel preparation to switch between product configurations faster while preserving inspection and cleaning requirements. A medical device manufacturer may redesign a fixture so operators can change it with quick-coupling features while maintaining controlled positioning.
The video below illustrates the kind of setup thinking that supports practical changeover improvement.
Don't treat SMED as a stopwatch contest. A faster setup that creates quality holds, unsafe handling, or repeated rework isn't a successful changeover. Train the team, track actual setup duration, and verify that the first good part meets the required standard.
5. Operator Training and Competency Development
Operators are often the first people to notice that a machine sounds different, a fixture is harder to load, a sensor is inconsistent, or a cycle is beginning to drift. Training turns those observations into useful action instead of informal workarounds.
Generic equipment training rarely fits the process. A medical device manufacturer may need operator certification that combines equipment operation, GMP procedures, quality verification, and escalation rules. A pharmaceutical facility needs consistent training across shifts so that one team doesn't compensate for a condition another team reports. An automotive supplier may use peer mentoring to transfer practical knowledge from experienced operators to new staff.
Teach the response, not only the button sequence
A strong curriculum combines hands-on practice, visual work instructions, short videos, written procedures, and teach-back verification. Ask operators to explain what they would do if a part fails inspection, a sensor alarm repeats, a pneumatic connection leaks, or the machine stops during a changeover. Their response shows whether the procedure is understood under pressure.
Point-of-use instruction is especially valuable on semi-automated equipment. A QR code at the station can open the current setup video or troubleshooting procedure, but digital access doesn't replace clear physical labels, safe access, and a defined escalation path.
Training should cover:
- Normal operation: Cycle sequence, standard settings, material presentation, and quality checks.
- Early warning signs: Abnormal noise, vibration, temperature, speed, alignment, or product behavior.
- First response: Safe stop, basic checks, fault classification, and escalation.
- Recovery: Approved reset and restart steps, with clear limits on operator intervention.
- Maintenance boundaries: Tasks operators may perform and conditions requiring a technician.
SEA's commissioning support includes operator training during installation and startup. That timing matters because the team can practice on the actual equipment, during real production conditions, while engineers can correct unclear instructions before habits form.
Measure training through repeat faults, defect patterns, downtime cause quality, operator feedback, and observed adherence to standard work. Refresher training should follow process changes, recurring errors, new product introductions, and long periods away from the station.
6. Total Productive Maintenance
Total Productive Maintenance, or TPM, makes equipment reliability part of daily production work. Operators clean, inspect, lubricate where authorized, check basic conditions, and report abnormalities. Maintenance technicians coach and support them. Engineers remove recurring design and process causes. Managers provide time, standards, and follow-through.
The model works because small abnormalities become visible before they develop into line-stopping failures. An operator who cleans a fixture and notices unusual wear can trigger a planned inspection. A technician who sees repeated contamination can recommend a guarding, sealing, or process change. A production supervisor who reviews recurring minor stops can prioritize engineering support rather than accepting them as normal.
Start with one line and make ownership visible
A pilot line provides a manageable place to establish standards. Record baseline Availability, Performance, and Quality, then define the operator tasks that support reliability without transferring specialized maintenance work to production staff.
Visual management supports the routine. Use clear cleanliness standards, inspection points, lubrication identifiers, abnormality tags, and 5S practices. These controls make it easier for teams across shifts to see whether the equipment is in a known condition.
TPM works best when maintenance technicians act as coaches rather than replacements for operators. Operators shouldn't be expected to diagnose electrical faults, modify controls, bypass guarding, or perform work outside their training. Their role is to maintain basic conditions, identify abnormalities early, and escalate accurately.
A pharmaceutical manufacturer may use TPM to support GMP equipment care and reduce equipment-related batch losses. A medical device assembly operation may train operators to maintain fixtures within approved limits, while engineering controls the validated process requirements. Semi-automated welding and assembly lines can also use operator inspections to catch fixture wear, cable damage, contamination, and alignment changes.
Avoid turning TPM into a compliance campaign based on completed forms. The useful question is whether the routine exposes and removes abnormal conditions. Review repeated tags, overdue actions, minor stops, and quality defects. If operators keep reporting the same issue, maintenance and engineering must address the underlying design or process cause.
7. Tooling, Fixturing, and Semi-Automation Upgrades
Some downtime is a design problem at the workstation. Operators repeatedly align parts, adjust a fixture, recover from inconsistent loading, clear awkward jams, or wait for a manual inspection. A targeted tooling or semi-automation upgrade can remove those repeatable losses without committing the plant to a fully automated line.
Start at the process step responsible for the most frequent or costly interruptions. Document operator motions, fixture adjustments, alarms, defects, material presentation, recovery steps, cleaning requirements, and changeover work. This evidence gives the engineering team a better design brief than a general request to “automate the station.”
SEA can design custom tooling, fixtures, integrated controls, manual equipment, and semi-automatic systems around a manufacturer's production goals and budget. That approach suits small and mid-sized manufacturers that need improved repeatability but still require flexibility for product variation, frequent changeovers, or manual judgment.
Choose the right level of intervention
A single smart fixture may be enough if alignment is the dominant cause. Integrated controls may be appropriate when sequence errors or missing confirmations create stops. A semi-automatic system can stabilize loading, pressing, testing, dispensing, or assembly while leaving material handling or product selection flexible.
Compare manual, semi-automatic, and fully automated options against:
- Volume and mix: High volume may justify more dedicated automation, while variable production may favor modular tooling.
- Quality requirements: Medical device and regulated processes may need documented confirmations and controlled settings.
- Labor and ergonomics: Remove difficult or repetitive motions where they create fatigue or inconsistent handling.
- Maintenance access: Design for cleaning, inspection, adjustment, and component replacement.
- Future change: Standardized interfaces and modular fixtures can protect flexibility as products evolve.
Define acceptance criteria before installation. Include cycle behavior, quality checks, guarding, changeover, operator training, alarm handling, and maintenance access. Commission the solution under real production conditions, then use OEE and downtime coding to confirm whether the targeted loss improved.
The cheapest equipment concept isn't always the lowest-cost solution. A design that saves capital but creates difficult service access, specialized spare parts, or operator frustration may increase lifetime downtime. Include commissioning, documentation, service, spare components, and ongoing support in the decision.
8. Spare Parts Inventory Management and Supply Chain Optimization
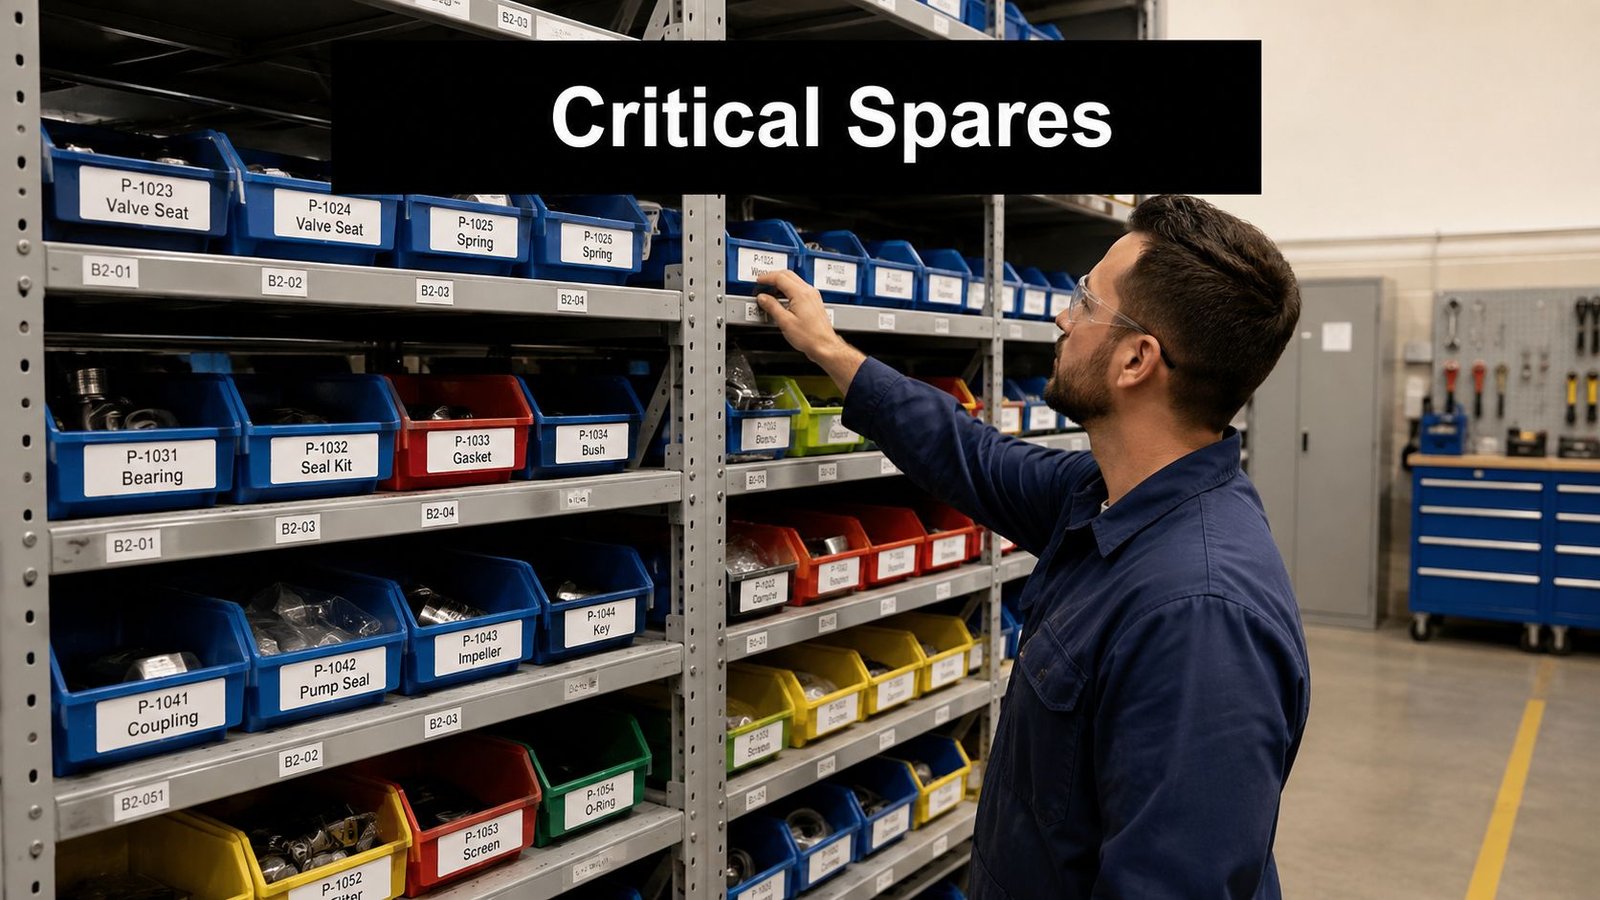
A repair can be technically simple and still keep a line down if the required sensor, seal, motor, connector, or actuator isn't available. Spare-parts management reduces repair duration by matching inventory to equipment criticality, supplier lead time, failure history, and the cost of carrying stock.
Begin with an equipment criticality review. High-impact components deserve stronger protection than low-consequence consumables, but that doesn't mean stocking every part. An ABC analysis can focus inventory investment on components that create the greatest operational exposure. A medical device manufacturer may hold critical sensors and sterilizable components locally when supplier lead time is significant. A semi-automated assembly line may keep an emergency kit at the point of use, with clear identification and controlled access.
Stock for risk, not anxiety
Link parts to asset records in a CMMS and record usage after every intervention. That history helps maintenance teams refine reorder points and identify components that fail repeatedly. Standardizing pump, motor, sensor, or connector specifications across similar equipment can reduce the number of unique items the facility must manage.
Supplier arrangements can also reduce exposure. Vendor-managed inventory or consignment may suit common consumables, while rapid-delivery agreements may be more appropriate for critical components. A pharmaceutical facility could arrange for a motor supplier to maintain minimum stock on site and bill for parts used, if the commercial and quality requirements support that model.
Use a tiered strategy:
- Emergency stock: Keep the most critical components immediately available.
- Routine replacements: Maintain practical coverage for common wear items.
- Supplier-supported stock: Use consignment or rapid replenishment for less frequent, high-value items.
- Obsolescence control: Review older electronics, seals, batteries, and other parts with storage or expiry risks.
Parts inventory must also support quality and traceability. Store components correctly, rotate older stock, verify specifications, and train staff on requisition procedures. A box of unlabelled substitutes may shorten one repair while creating a quality or validation problem.
9. Equipment Redundancy and Fault Tolerance Design
Redundancy prevents a single component or subsystem failure from stopping the entire process. Parallel conveyors, backup compressors, dual pumps, modular process paths, spare chambers, and automatic failover can preserve production when one element needs repair.
This strategy has a clear trade-off. Redundancy increases capital cost, controls complexity, maintenance obligations, validation work, and space requirements. It shouldn't be added to every workstation. It makes more sense where downtime carries a high business, safety, customer, or regulatory consequence.
A sterile pharmaceutical filling operation may use dual filling heads so production can continue at a reduced rate when one head is unavailable. A medical device facility may install a backup nitrogen compressor with automatic activation. A semiconductor process can shift work between chambers when one chamber requires service. A moisture-sensitive drying system may use redundant vacuum pumps with automatic switchover.
Design resilience around the real constraint
First identify the operation that limits recovery. Component-level redundancy, such as two motors, may be sufficient when the process path remains intact. Subsystem-level redundancy, such as dual conveyors or parallel stations, may be necessary when one failed module would otherwise block material flow.
Before approving the investment, compare the downtime exposure with the redundancy cost. A design guide in the brief recommends a payback period of less than three years for redundancy investments, but the actual calculation should use the manufacturer's own production value, risk exposure, validation needs, and service costs (downtime improvement and OEE guidance).
Automatic switchover is preferable for critical systems when manual intervention would extend the interruption. The backup must still receive PM, inspection, testing, and activation exercises. A neglected standby unit is not resilience, it's deferred failure.
Soft redundancy may cost less. Buffer inventory, an alternate production method, cross-trained technicians, or a second qualified supplier can provide recovery without duplicating the entire equipment path. Document switchover procedures, alarm behavior, operator actions, maintenance access, and return-to-primary conditions during the design phase.
Downtime Reduction: 9-Strategy Comparison
| Strategy / Item | Implementation Complexity (🔄) | Resource Requirements (⚡) | Expected Outcomes (⭐ / 📊) | Ideal Use Cases (💡) | Key Advantages (⭐) |
|---|---|---|---|---|---|
| Performance Monitoring and OEE Tracking | Moderate → High 🔄 (data integration, real-time state capture) | ⚡ Sensors/CMMS/MES, dashboards, analytics staff | ⭐ High, measurable OEE improvements and trend visibility 📊 | 💡 Post-commissioning optimization, multi-line benchmarking, ROI validation | ⭐ Data-driven prioritization; visibility into loss sources |
| Root Cause Analysis (RCA) and Problem-Solving | Moderate 🔄 (structured facilitation, cross-functional time) | ⚡ Skilled facilitators, team time, documentation tools | ⭐ High, large reduction in recurring failures; long-term cost savings 📊 | 💡 Repeating failures, quality incidents, design validation | ⭐ Eliminates root causes; builds organizational problem-solving |
| Preventive & Predictive Maintenance (PM & PdM) | High 🔄 (sensors, analytics, CMMS integration) | ⚡ Vibration/thermal sensors, CMMS, data scientists, training | ⭐ High, fewer failures, optimized maintenance costs, extended life 📊 | 💡 Critical/expensive equipment, semi-/fully-automated lines | ⭐ Condition-based servicing; reduces unnecessary work and downtime |
| Quick Changeover / SMED | Moderate 🔄 (process redesign, tooling changes, training) | ⚡ Quick-couplings, redesigned fixtures, operator training | ⭐ High, dramatic changeover time reduction; higher utilization 📊 | 💡 High-mix production, frequent SKU changeovers, small batches | ⭐ Enables smaller lot sizes; boosts responsiveness and throughput |
| Operator Training & Competency Development | Low → Moderate 🔄 (program design and continuous delivery) | ⚡ Trainers, training materials, time for hands-on practice | ⭐ Moderate → High, fewer operator-caused stops; quality gains 📊 | 💡 New systems, high-turnover environments, regulated ops | ⭐ Faster detection/troubleshooting; builds internal capability |
| Total Productive Maintenance (TPM) | High 🔄 (cultural change, long rollout, cross-functional buy-in) | ⚡ Significant training, leadership commitment, OEE tracking | ⭐ High, sustained OEE and reliability improvements over time 📊 | 💡 Facility-wide reliability programs, sustained continuous improvement | ⭐ Embeds ownership across workforce; multiplies local improvements |
| Tooling, Fixturing & Semi-Automation Upgrades | High 🔄 (custom engineering, controls integration) | ⚡ Engineering design, capital for fixtures/equipment, commissioning | ⭐ High, improved repeatability, quality, and reduced labor 📊 | 💡 Problematic workstations, legacy lines needing stability | ⭐ Targeted fixes with scalable ROI; preserves flexibility |
| Spare Parts Inventory & Supply Chain Optimization | Moderate 🔄 (criticality analysis, inventory models) | ⚡ CMMS integration, capital for stock, supplier arrangements | ⭐ Moderate → High, shorter repair times; lower expediting costs 📊 | 💡 Long lead-time suppliers, critical spares, regulated sites | ⭐ Reduces time-to-repair; balances availability vs. carrying cost |
| Equipment Redundancy & Fault-Tolerance Design | Very High 🔄 (system design, control logic, floor space) | ⚡ Additional capital, duplicate equipment, maintenance effort | ⭐ Very High for critical uptime, prevents catastrophic stops 📊 | 💡 Mission-critical processes, high downtime cost, GMP-critical | ⭐ Ensures continuity; enables planned maintenance without impact |
Turn Downtime Data Into the Next Upgrade
The most effective downtime reduction strategies form a staged operating system, not a disconnected list of projects. Begin by defining what counts as downtime and recording the who, what, when, where, and why. A simple run, idle, and down signal with operator-friendly reason codes can expose whether the largest loss comes from equipment failure, changeovers, material shortages, quality stops, or maintenance response. Guidance for manufacturers emphasizes that trustworthy classification should come before buying more technology (practical downtime reduction guidance).
Establish a four-week baseline on critical equipment. Track Availability, Performance, Quality, downtime minutes by cause, changeover duration, mean time to repair, and repeat failures. Don't start with every asset if the team lacks the capacity to maintain the data. A focused baseline on a bottleneck line often produces more useful decisions than a broad system filled with inconsistent entries.
Next, rank the losses. Use RCA for recurring breakdowns and major events. Correct weak reason codes when the data shows ambiguity. Review whether preventive maintenance is being completed at the right frequency, then add predictive monitoring where the failure cost justifies sensors, analytics, and engineering response. Predictive maintenance adoption has gained practical traction, with a 2026 Fluke survey of more than 600 maintenance decision-makers across the United States, United Kingdom, and Germany reporting adoption rising from 9% to 18% year over year (Fluke maintenance survey coverage).
Sequence the investment
A sensible implementation path is:
- Measure first: Establish reliable downtime categories, OEE data, and asset criticality.
- Solve recurrence: Apply RCA, FMEA, standard work, and engineering changes to repeated failures.
- Stabilize reliability: Balance PM with condition-based and predictive maintenance.
- Reduce process losses: Improve changeovers, fixtures, tooling, operator training, and TPM routines.
- Scale selectively: Evaluate semi-automation, integrated controls, and monitoring where the loss pattern supports them.
- Protect the bottleneck: Add spare-parts readiness, supplier support, alternate methods, or redundancy where recovery risk is high.
The best upgrade may be a fixture, a sensor, a training module, a spare motor, or a control change. It may also be a fully engineered semi-automatic system. The decision should follow the loss data, production mix, quality requirements, service capability, and available budget.
System Engineering & Automation can help manufacturers move from diagnosis to implementation through custom fixtures, tooling, integrated controls, semi-automatic systems, installation, commissioning, maintenance, and ongoing service support. For medical device and other regulated production environments, involve quality and engineering early so that the improvement remains safe, maintainable, documented, and practical for every shift.
System Engineering & Automation offers custom tooling, fixtures, integrated controls, semi-automatic systems, commissioning, maintenance, and ongoing support for manufacturers working to reduce downtime. Visit System Engineering & Automation to discuss the production constraint, service requirement, or workstation upgrade that should be solved first.