A line goes down in the middle of the shift. The supervisor hears about it three different ways. One operator says the machine alarmed out. Maintenance thinks it's a sensor issue. Scheduling only knows the job is now late. Everyone moves fast, but nobody starts with the same facts.
That's the true cost of poor visibility. The lost production matters, but so do the phone calls, the rushed troubleshooting, the guesswork on restart, and the awkward customer update when delivery slips. In a small or mid-sized plant, one machine problem can spill into labor, quality, and shipping within an hour.
Machine monitoring software matters because it turns that uncertainty into usable information. Instead of asking what happened after the fact, you can see what stopped, when it stopped, how long it stayed down, and whether the pattern is isolated or chronic. For operations teams trying to raise throughput without replacing half the plant, that shift is usually where improvement starts.
Table of Contents
- From Reactive Fixes to Proactive Production
- What Is Machine Monitoring Software
- Core Metrics and Must-Have Software Features
- How Monitoring Drives Performance in Manufacturing
- Integrating Monitoring with Your Existing Equipment
- Calculating the ROI of Machine Monitoring
- Your Vendor Selection and Deployment Checklist
From Reactive Fixes to Proactive Production
Most plants don't buy machine monitoring software because they want another dashboard. They buy it because they're tired of managing production through interruptions. A machine goes down, operators wait, maintenance gets pulled off another job, and by the time someone logs the reason, the story has already changed.
That reactive cycle gets expensive fast. The visible loss is machine downtime. The hidden loss is everything wrapped around it: overtime to recover, schedule reshuffling, material sitting between processes, and quality risk when people rush to get back on plan.
What the shop floor looks like without visibility
In a mixed-fleet environment, the problem gets worse. One machine may provide usable status data. The older one beside it may provide almost nothing unless someone writes it down. That leaves the plant manager with partial truth, which is often worse than no data at all because decisions look informed when they aren't.
Practical rule: If your downtime review starts with “what do we think happened,” you don't have a monitoring problem. You have a control problem.
Machine monitoring software changes that by making machine state visible in real time. Instead of relying on delayed reports, the team can see machine status, interruption patterns, and production behavior as it happens. That's one reason the market has expanded well beyond early adopters. The global CNC machine monitoring software market was valued at USD 135 million in 2024 and is projected to reach USD 195 million by 2032, while cloud-based deployments account for about 85% of installations according to Intel Market Research's CNC machine monitoring software market summary.
What proactive production actually means
Proactive production doesn't mean every issue gets predicted in advance. It means the team stops losing time to basic uncertainty.
A practical shift usually looks like this:
- Operators respond faster because they can see machine state and alerts clearly.
- Maintenance prioritizes better because recurring faults are visible instead of anecdotal.
- Production managers schedule with more confidence because they know which assets are available.
- Quality teams get better context because process interruptions no longer disappear into tribal knowledge.
That's the point where machine monitoring software stops being “nice to have” software and starts functioning like plant infrastructure.
What Is Machine Monitoring Software
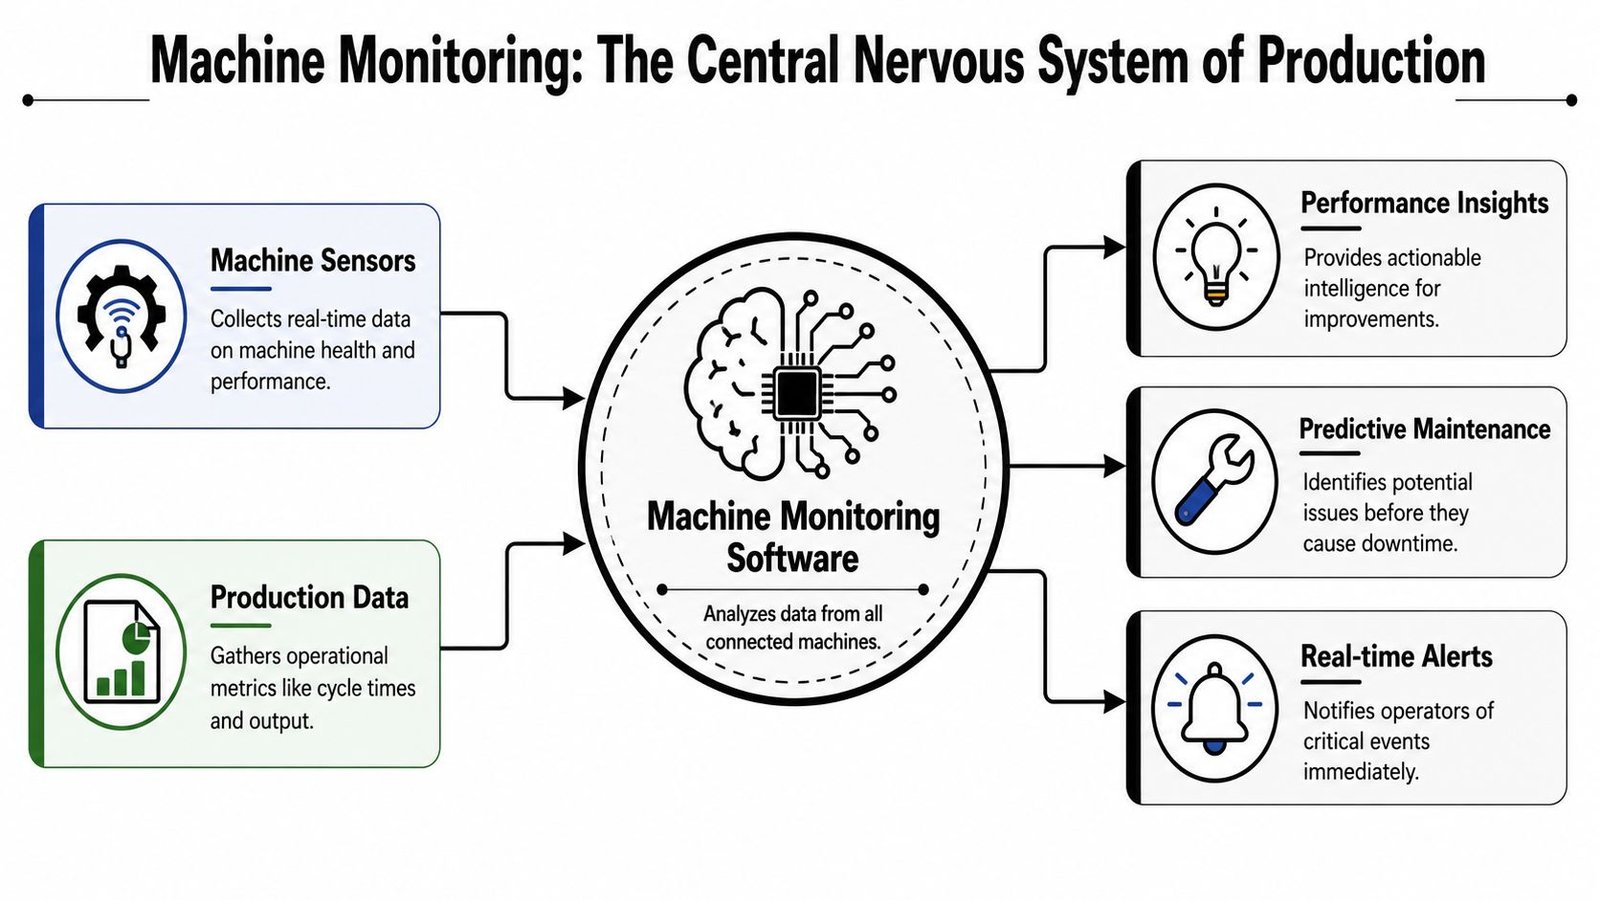
Machine monitoring software captures what production equipment is doing, records it in a usable format, and shows the plant where time and output are being lost. In practice, it sits between the machine and the people responsible for production, maintenance, quality, and scheduling.
For a small or mid-sized manufacturer, that definition matters because the software has to work across a mixed fleet. One plant may have newer CNCs with accessible controller data, older manual or semi-automated assets with basic I/O signals, and a few packaged machines that were never designed for modern connectivity. A useful system has to handle that reality without forcing a full equipment replacement program.
It starts with data collection
Data collection is the foundation. The software gathers signals from machine controls, PLCs, external sensors, edge devices, or a combination of those sources. On a newer machine, that may include direct status tags and cycle information. On older equipment, it may be limited to power-on, run, stop, and fault inputs captured through a retrofit.
Common inputs include:
- Machine status such as running, idle, fault, or stopped
- Cycle counts to confirm whether parts are being produced
- Run time to separate real utilization from assumed utilization
- Reason codes to classify why lost time happened
That last point is where many projects succeed or fail. If a machine only reports "stopped," the team still has to guess whether the cause was setup, waiting on material, operator absence, maintenance work, or a true equipment fault.
The software turns signals into production context
Collecting signals is the easy part. Turning them into information the plant can trust is harder.
The software has to interpret events consistently, apply timestamps, store records, and present downtime in a way that supports action. Weak systems create a lot of activity but very little clarity. They log every state change, yet the plant still cannot tell which interruptions hurt output, which are expected, and which should trigger maintenance or supervisor response.
A useful platform does a few jobs well:
| Function | Why it matters |
|---|---|
| Event interpretation | Separates normal machine behavior from actual production loss |
| Time stamping | Creates a reliable history for troubleshooting, review, and escalation |
| Downtime classification | Supports root-cause analysis instead of general complaints |
| Data storage | Preserves records for trend analysis, audits, and management review |
In GMP-aware environments such as medical device manufacturing, this matters even more. The plant is not only trying to improve uptime. It also needs records that are complete, reviewable, and consistent enough to support investigations, batch history, deviation review, or process validation work. If timestamps drift, reason codes are edited loosely, or records disappear after a software update, the system creates compliance risk instead of operational value.
Dashboards are the delivery layer, not the product
Dashboards matter because people need fast answers.
Operators need to know whether a machine is waiting on them or on something else. Supervisors need to see where the current shift is losing time. Manufacturing engineers need enough history to find recurring stoppages and justify corrective action. Quality teams in regulated settings need confidence that the record matches what happened on the floor.
A dashboard is useful only when someone can answer, within seconds, whether a machine is running, why it stopped, and who needs to act.
That is what machine monitoring software is at its best. It gives the plant a dependable record of machine behavior, makes hidden losses visible, and works across the equipment the business already owns. For smaller manufacturers, especially those retrofitting older assets, that practicality matters more than flashy screens or long feature lists.
Core Metrics and Must-Have Software Features
Plenty of software demos look impressive until you ask one simple question: what will this help the plant improve next month? If the answer is vague, the feature set probably isn't tied to production losses tightly enough.
The strongest machine monitoring software platforms are built around a few operational metrics that matter every day, not just at the monthly review.
Why OEE still matters
Overall Equipment Effectiveness, or OEE, remains the most useful high-level scorecard when teams understand what sits underneath it. It's not magic. It's a structured way to see whether a machine was available, whether it ran at the expected pace, and whether it made acceptable output.
Those three components matter because they point to different owners:
- Availability tells you how much scheduled time was lost.
- Performance shows whether the asset ran at the intended speed when it was running.
- Quality shows whether output was good enough to count.
When people complain that OEE is misleading, the usual problem isn't OEE itself. The problem is weak data capture. If stops aren't recorded accurately or reason codes are sloppy, the number loses credibility.
Features that actually change performance
The best gains don't come from passive visibility. They come from software that pushes action back onto the floor. Caddis Systems' guide to CNC machine monitoring notes that the biggest gains typically happen when monitoring is tied to disciplined workflows such as real-time alerts and structured reason-code capture, with cited results in the range of 20% to 50% reductions in unplanned downtime.
That has direct implications for feature selection.
| Feature | What it does in practice | What happens if it's missing |
|---|---|---|
| Real-time status dashboard | Shows current machine state across the floor | Supervisors find out late |
| Automated alerts | Shortens response time to faults and extended stops | Small delays become long downtime events |
| Structured reason codes | Turns downtime into searchable categories | Losses get blamed on “miscellaneous” |
| Historical event log | Supports engineering review and recurring issue analysis | The same faults keep returning |
| Role-based views | Gives operators, maintenance, and managers the right level of detail | Everyone gets either too much or too little information |
A few trade-offs are worth calling out.
- More detail isn't always better. If operators need too many inputs, data quality drops.
- Fully automatic capture isn't enough by itself. Some causes still need human classification.
- Fancy analytics don't help if event coverage is incomplete. Reliable stop capture matters more than impressive charts.
The software earns its keep when it helps the team answer two questions quickly: what is the biggest loss, and who owns the fix?
For most plants, that means looking past glossy screens and checking whether the system can support alerting, clean downtime classification, and disciplined review routines.
How Monitoring Drives Performance in Manufacturing
Machine monitoring software proves its value on the floor, not in a slide deck. The effect looks different depending on the plant. A high-mix machine shop uses it one way. A GMP-aware medical device manufacturer uses it another.
The operating principle is the same. The plant stops relying on assumptions and starts acting on events, trends, and verified production history.
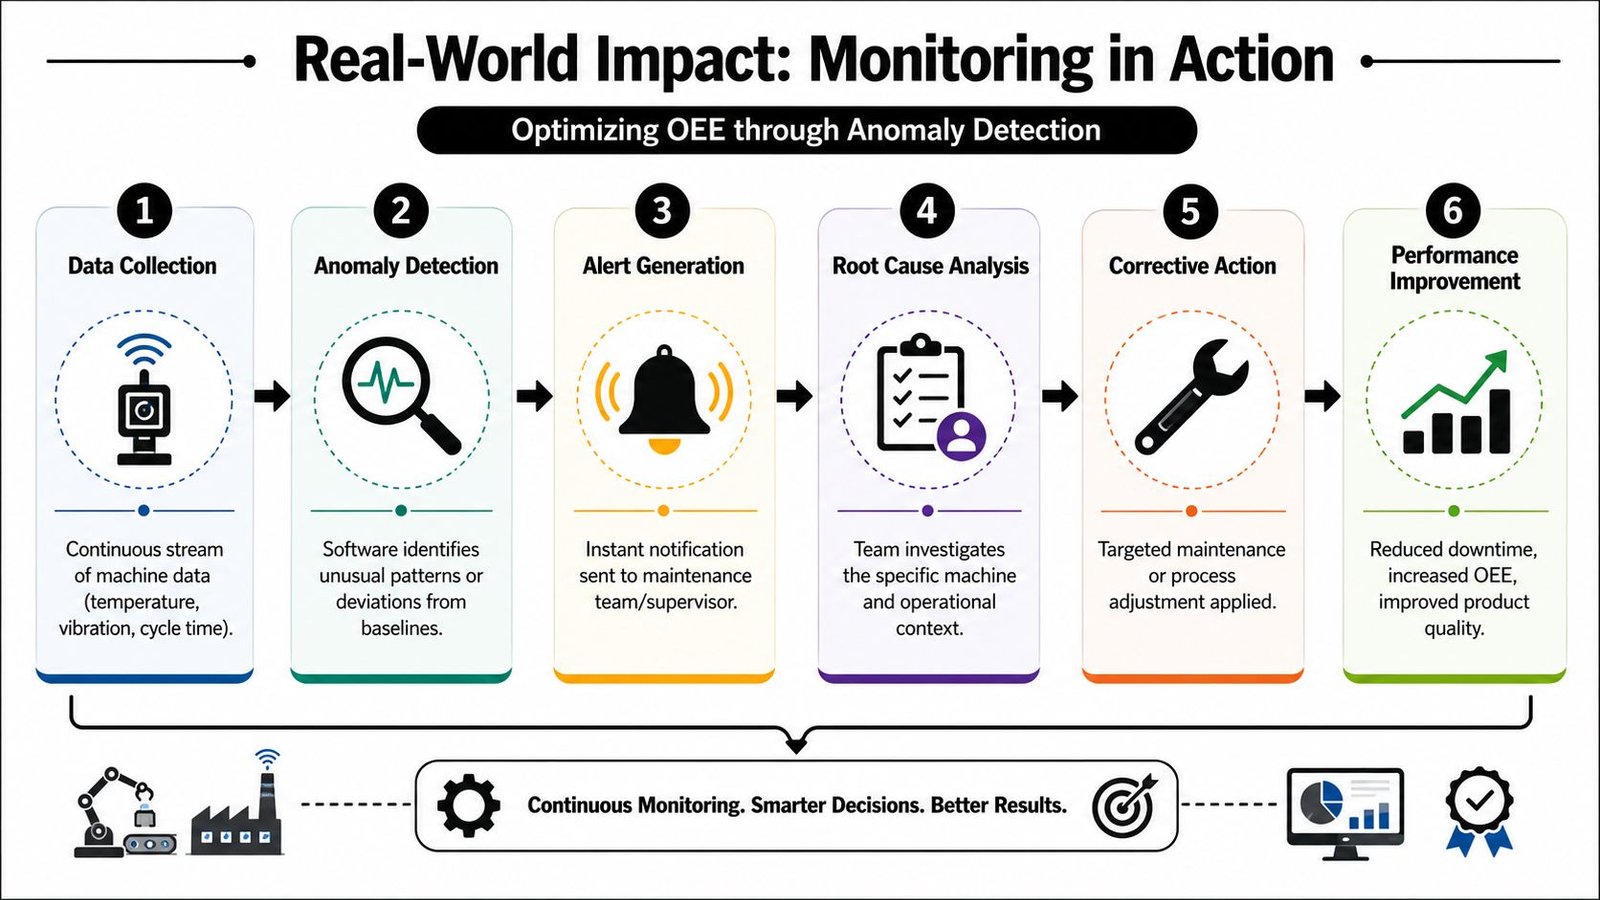
To make that flow concrete, this diagram shows how anomaly detection can turn raw machine signals into measurable improvement.
A CNC shop example
In a busy CNC shop, the biggest waste often isn't a dramatic failure. It's the accumulation of small delays: machines waiting on setup approval, long gaps between cycles, repeated stoppages for tooling issues, and jobs that appear on schedule but aren't moving.
Machine monitoring software exposes those patterns quickly. A supervisor can see whether a machine is idle because the program ended, because the operator was pulled away, or because a fault wasn't escalated. That changes the conversation in the morning meeting. Instead of discussing impressions, the team can review actual stop history and decide where to intervene.
For plants pursuing broader real-time automation strategies, monitoring often becomes the first layer that makes later automation decisions smarter. You find bottlenecks before you automate the wrong thing.
A short walkthrough can help visualize how teams use those signals in practice.
A medical device example
In medical device manufacturing, the value case expands beyond uptime. The plant still cares about output, but it also needs trustworthy records, controlled processes, and cleaner evidence of what happened during production.
That changes how machine monitoring software should be judged.
- Traceability matters more. The system should preserve event history clearly enough to support review.
- Parameter awareness matters. Teams need confidence that a process stayed within defined operating conditions.
- Manual logging should shrink where possible. Handwritten or delayed records create avoidable risk.
This doesn't mean every monitoring platform is automatically suitable for a GMP-aware environment. Some are built for simple production visibility and little else. Others are better suited to plants that need stronger discipline around records, exceptions, and change control.
In regulated production, “we think the machine was stable” isn't a useful statement. Teams need records they can review and defend.
That's why the same software category can feel very different from one plant to another. In a job shop, the first win may be utilization. In a medical device facility, the first win may be cleaner process evidence with less manual effort.
Integrating Monitoring with Your Existing Equipment
A plant manager usually asks one question first: will this connect to the machines we already have?
For small and mid-sized manufacturers, that question decides whether the project produces value or stalls in engineering review. Few plants run a clean, single-vendor environment. The real situation is a mixed fleet. Newer CNCs sit beside older presses, semi-automatic stations, packaging equipment, and specialty machines that were never built to share data cleanly.
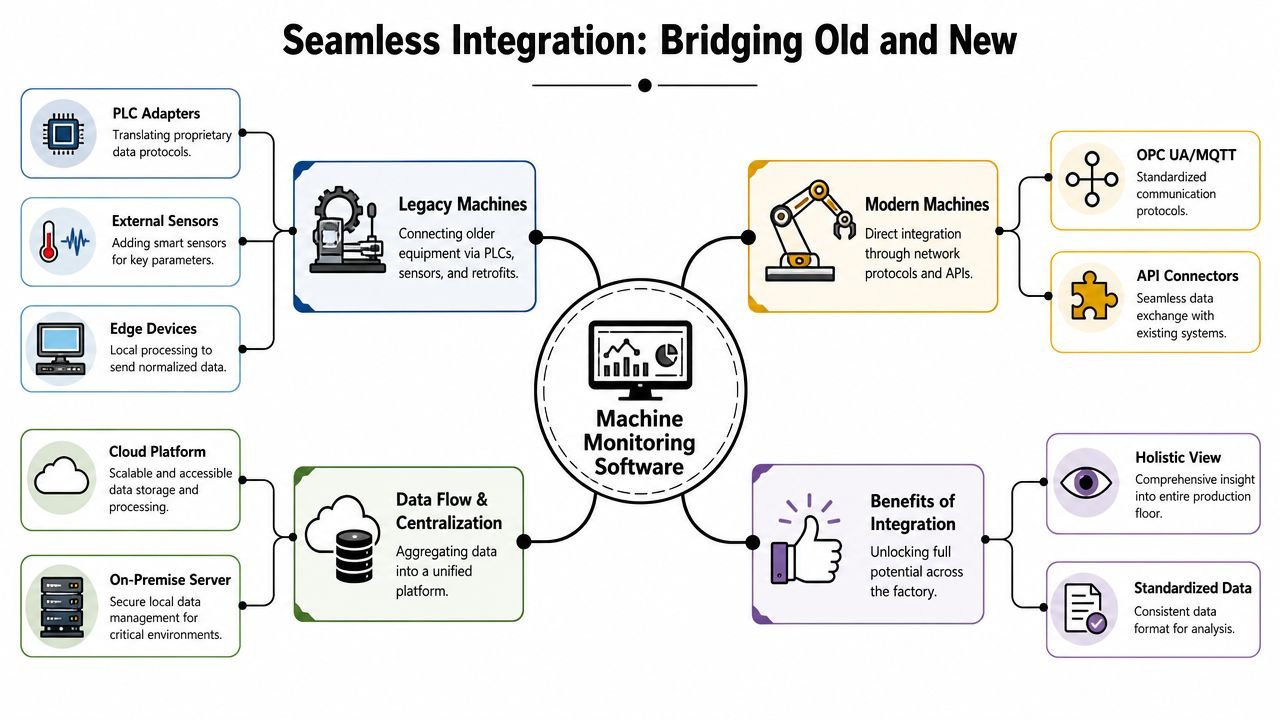
The integration plan should reflect that reality.
Sort the fleet before you buy anything
Start by classifying machines by connection path, not by age alone. A twenty-year-old asset with accessible PLC signals may be easier to monitor than a newer standalone machine with limited access to useful data.
That first pass usually puts equipment into three practical groups:
- Machines with native connectivity. These are the fastest to bring online and usually provide better state and event detail.
- Machines with usable control signals but no direct software connection. These often need PLC reads, protocol conversion, or a gateway.
- Machines with little accessible data. These may still justify basic run, stop, and fault monitoring if they affect throughput or compliance.
This sorting exercise prevents a common purchasing mistake. Teams buy a platform based on what it can do on the newest assets, then discover half the floor needs extra hardware, controls work, or custom configuration.
What retrofit work usually involves
Retrofitting older equipment is often less dramatic than people expect. In many plants, the practical options are straightforward: read existing PLC states, capture stack light signals, add current sensors, or install a gateway that converts machine signals into something the monitoring platform can use.
For manufacturers reviewing broader automation and control systems integration options, OT discipline matters at this stage. The goal is to collect useful machine states without creating a one-off wiring project that becomes hard to maintain six months later.
A simple decision guide helps keep scope under control:
| Machine type | Typical connection path | Main trade-off |
|---|---|---|
| Newer CNC with accessible control data | Native connection or standard protocol path | Faster setup, better data depth |
| Legacy machine with PLC | Direct PLC signal integration | Good practicality, moderate engineering effort |
| Standalone older asset with limited controls access | External sensors or gateway device | Basic visibility, less detailed context |
The trade-off is simple. Deeper data takes more engineering time. Basic state monitoring gets deployed faster and often delivers enough insight to cut downtime, improve response time, and build a credible ROI case.
Match the connection method to the business problem
Plants get into trouble when they chase maximum data from every machine on day one. That approach raises cost, slows deployment, and creates avoidable frustration for maintenance, controls, and IT.
A better method is to ask a narrower set of questions:
- Which machines constrain output or create the most downtime pain?
- What is the minimum reliable signal needed to confirm run, stop, fault, or cycle?
- Which assets need deeper parameter history because quality, traceability, or GMP expectations are higher?
That third question matters in medical device and other GMP-aware environments. A packaging line may only need trustworthy state data and event timestamps. A process-critical station may need cleaner exception records, parameter awareness, and a connection approach that supports review without relying on handwritten logs or operator memory.
Older equipment should not be excluded just because it lacks modern connectivity. If a legacy machine is the bottleneck, even simple monitoring can pay back quickly. Perfect data is rarely the requirement. Reliable data that helps supervisors act faster usually is.
Calculating the ROI of Machine Monitoring
A plant manager usually approves machine monitoring for one reason. The numbers show it will recover more value than it costs.
That calculation gets clearer in small-to-mid-sized plants because the losses are usually concentrated. One bottleneck machine running older controls can dictate output for an entire cell. One packaging line with weak downtime records can distort labor planning for a full shift. In GMP-aware environments such as medical device manufacturing, the cost is not limited to lost runtime. Delayed event records, weak exception tracking, and manual reconstruction after a stop also create quality and compliance risk.
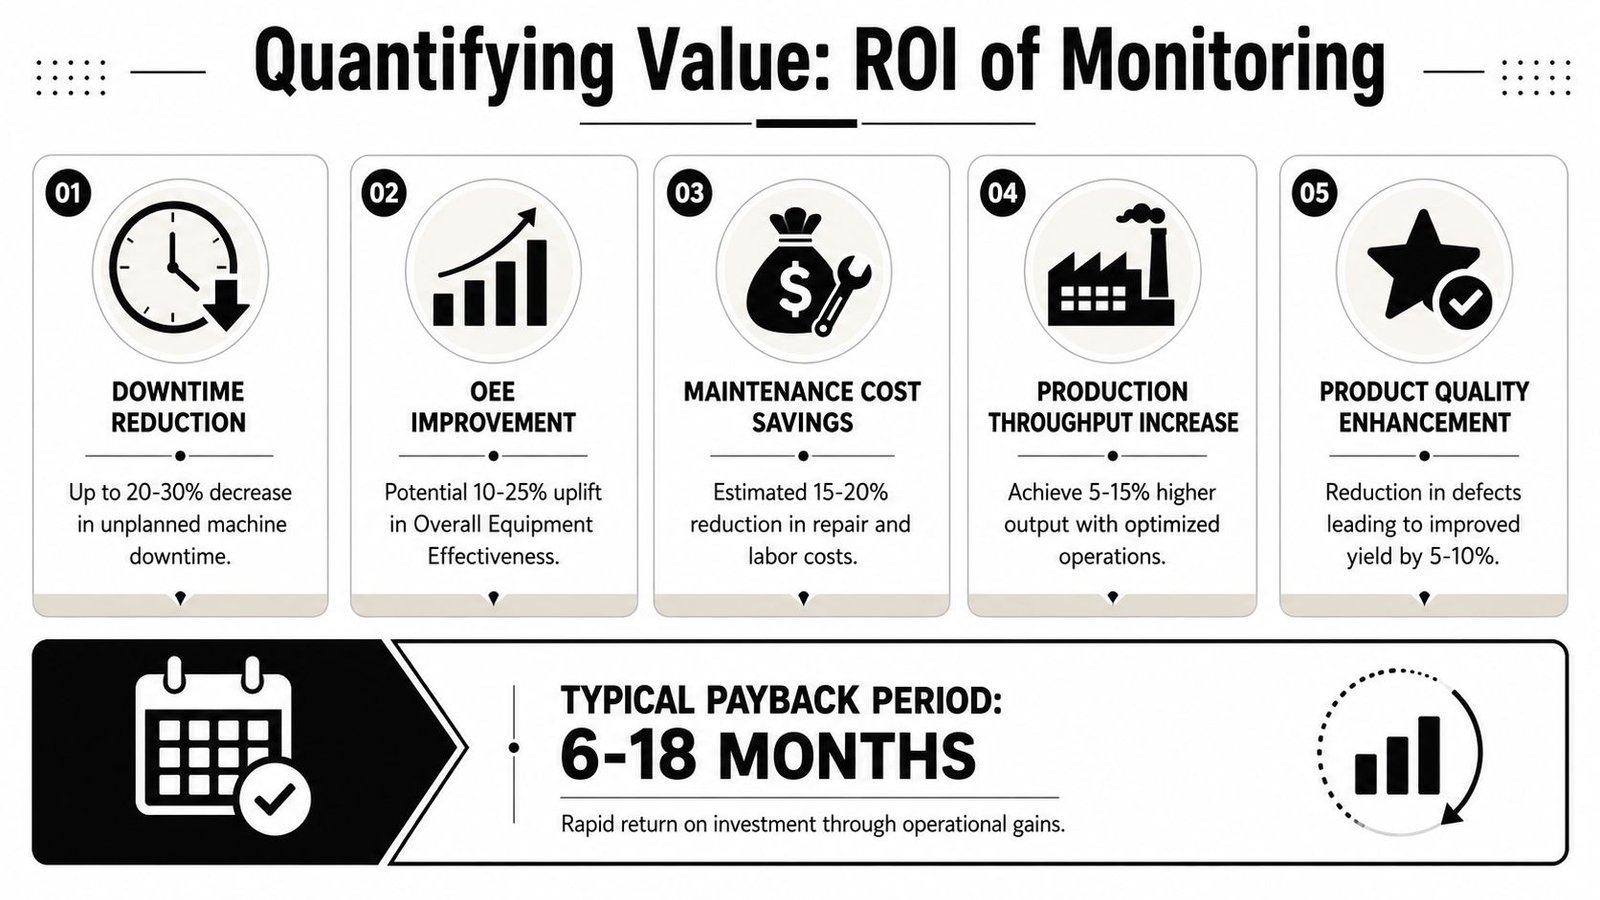
Start with the cost of doing nothing
A useful ROI model is simple enough to defend in a budget meeting and grounded enough to survive scrutiny from operations, finance, and quality.
Start with the losses the plant already absorbs:
- Downtime recovery from faster response and clearer fault history
- Output recovery from reducing hidden idle time, minor stops, and slow cycles
- Labor efficiency because supervisors, operators, and maintenance stop chasing status by phone, radio, or manual checks
- Quality and record support when interruptions are captured with timestamps instead of reconstructed later from handwritten notes
For retrofits, separate wish-list value from reachable value. A legacy CNC, press, or assembly station often produces a strong return from basic run, stop, and fault signals alone. Full parameter capture may come later. That staged approach usually lowers upfront cost and gets the pilot live sooner.
A simple ROI framework looks like this:
| Step | Question |
|---|---|
| 1 | What is current unplanned downtime costing on the pilot machines? |
| 2 | What production value is lost when cycle performance slips or machines sit idle? |
| 3 | What one-time connection and recurring software costs will the pilot require? |
| 4 | What savings or recovered capacity can reasonably be credited to the pilot improvements? |
Count costs the plant will actually incur
Plants often underestimate deployment cost by focusing only on software price.
Include signal validation, controls support, gateway hardware where needed, dashboard setup, supervisor training, and time spent standardizing downtime reasons. If the fleet includes older mixed-brand equipment, connection effort will vary by machine. One asset may expose usable signals in a few hours. Another may need relays, sensors, or a small panel modification to produce trustworthy state data.
In regulated production, include validation work too. If the monitoring records will support batch review, exception handling, or device history documentation, the project may also need alignment with your factory acceptance test software process. That work adds effort, but it also makes the ROI case stronger because the system supports production control and record discipline at the same time.
Use leading and lagging KPIs
Monthly OEE and downtime totals matter, but they are not enough to manage a pilot well. Plants that get payback fastest usually track the behaviors that lead to improvement.
Use both types of KPI:
- Leading KPIs include alert response time, percentage of downtime events with valid reason codes, and completion of daily loss review follow-up
- Lagging KPIs include OEE trend, downtime hours, schedule attainment, and scrap trend where applicable
That distinction matters because software does not create savings by itself. Production, maintenance, and supervision create savings when they respond faster, classify losses correctly, and fix repeat problems.
A dashboard does not generate ROI. Faster intervention, better classification, and repeatable follow-up do.
The best pilot cases stay conservative. Credit the system for the losses it helped the team see and reduce, not every gain that happened during the same quarter. That makes expansion easier to justify, especially in plants with older equipment, limited engineering bandwidth, and quality requirements that demand cleaner records as well as better uptime.
Your Vendor Selection and Deployment Checklist
It is 10:15 on a Tuesday. The bottleneck machine is down again, supervisors are asking for status, maintenance is chasing the cause, and nobody agrees on how much time was lost. That is the point where vendor selection matters. If the platform cannot capture reliable events from the equipment you already own, and if the rollout does not fit how your plant makes decisions, the project turns into another dashboard nobody trusts.
Good deployments stay narrow at the start. They solve a specific production problem, prove that the data is credible, and show how the plant will use that data to reduce downtime, improve schedule performance, or tighten records in a GMP-aware environment.
Define your goals
Set the pilot up around one or two losses that matter to the business. Start with the constraint, not with a software feature list.
Strong pilot goals usually look like this:
- Recurring unplanned stops on a bottleneck machine, line, or cell
- Poor schedule confidence because machine state is unclear or delayed
- Weak downtime categorization that blocks useful root-cause review
- Documentation gaps in regulated or documentation-sensitive production where manual logs are late, incomplete, or hard to verify
Keep the scope tight. A plant trying to fix downtime, scrap, labor reporting, maintenance planning, and traceability in one pilot usually gets a weak result on all five.
Assemble your team
Machine monitoring sits in the middle of production, maintenance, controls, IT, and sometimes quality. Leave one of those groups out, and the project stalls as soon as signal mapping, access rules, or response workflows need a decision.
Keep the team small, but give each function a clear job:
- Production owner to define the losses that matter and review daily results
- Maintenance or controls support to confirm signal quality and machine-state logic
- Quality representation if records, review, or audit expectations apply
- Operations or planning leadership to turn visibility into schedule and staffing decisions
In medical device and other GMP-aware environments, quality should be involved before the pilot starts, not after the first review meeting. That avoids rework if event history, review practices, or exception handling need tighter control than a general industrial deployment.
Select a pilot area
Choose a pilot area that reflects the plant you operate. For small and mid-sized manufacturers, that often means a mixed fleet with at least one older asset, one machine people depend on every shift, and one area where supervisors will act on the information immediately.
Do not start with the easiest machine to connect if it tells you nothing about wider rollout risk.
A good pilot area usually has these traits:
- It includes a real production constraint or chronic source of delay
- It represents the controls mix you have across the plant, including legacy equipment if that is part of your reality
- It has operators, leads, and maintenance staff who will use the data daily
- It is important enough that improvement will be noticed, but contained enough that the team can support it properly
The point is to test operational fit, not just technical connectivity. Mixed-fleet plants learn more from one older CNC and one semi-automated cell than from a pilot built only around the newest machine in the building.
Pick a pilot where the floor will act on the data every day. Usage drives payback.
Choose the right vendor
Vendor demos are easy. Connecting to older equipment, handling unreliable signals, supporting reason-code discipline, and fitting into a regulated review process are harder. Ask questions that expose those trade-offs early.
Use this checklist:
- Connectivity fit. Can the vendor connect to the PLCs, CNCs, relays, and manual inputs in your pilot without forcing a controls retrofit you did not budget for?
- Machine-state logic. How do they define run, idle, fault, blocked, and changeover on different equipment types?
- Downtime workflow. Can the system capture events automatically and still let operators or leads apply practical reason codes without slowing the shift?
- Usability on the floor. Can a supervisor find the last hour of loss in seconds? Can an operator enter a reason code quickly and accurately?
- Deployment model. What hardware, networking, and IT involvement are required at the pilot stage?
- Expansion path. If the pilot works, can the system scale across more assets and sites without rebuilding the architecture?
- Validation and review support. In GMP-aware settings, can the platform support controlled records, review expectations, and disciplined change handling?
If your rollout also affects formal equipment verification and acceptance, align it with your broader factory acceptance test software process so machine behavior, controls logic, and production records stay aligned.
Run the pilot correctly
A pilot needs to answer two questions. Is the data trustworthy, and will the plant use it to change behavior?
Run it with a simple operating cadence:
- Baseline current performance before the software goes live.
- Verify every key signal so maintenance, production, and supervision trust the machine-state model.
- Keep reason codes limited and clear so people use them consistently.
- Review losses every day with the people who can fix them.
- Record actions taken so any gain can be tied to a specific response, not general plant noise.
Many pilots slip in situations where the system captures events, but nobody owns the review, nobody closes the loop on repeat faults, and the project gets judged on screen quality instead of production results.
For smaller manufacturers, that discipline matters even more because engineering time is limited. The pilot has to prove that the software fits the team you have, not the team you wish you had.
System Engineering & Automation helps manufacturers turn production problems into practical automation projects that fit real budgets, legacy equipment, and regulated environments. If you're evaluating machine monitoring software as part of a broader upgrade, System Engineering & Automation can help you assess your equipment, define a sensible pilot, and build a solution that improves visibility, quality, and throughput without forcing a full plant overhaul.