A process capability analysis is a statistical method that quantifies whether a stable, predictable process can consistently meet engineering or customer specification limits. That answer helps operations managers decide whether a tooling adjustment, fixture upgrade, sensor package, semi-automated retrofit, or full replacement is justified.
A familiar situation plays out on many production floors. A CNC cell is making parts that look acceptable, the SPC chart is mostly green, and the team believes the process is under control. Then final inspection finds scrap, or a customer reports dimensional drift that nobody saw coming.
The issue usually isn't whether the process has behaved predictably during a short observation window. The more useful question is whether the process, as it runs today, can stay inside the specification limits that matter to the customer across normal production conditions. Capability analysis turns that question into evidence.
Table of Contents
- The Question Behind Every Quality Number
- What Process Capability Analysis Actually Measures
- Cp, Cpk, Pp, and Ppk Explained Without the Jargon
- Data, Sampling, and the Prerequisites That Change the Answer
- Worked Examples From a Shop Floor and a Cleanroom
- Common Pitfalls That Make Capability Numbers Lie
- From Capability Results to the Right Automation Decision
The Question Behind Every Quality Number
The operations manager standing beside the cell needs an answer that a control chart alone can't provide. A control chart helps show whether the process is stable and whether special causes are present. It doesn't, by itself, show whether the stable process fits comfortably inside the customer's tolerance band.
That distinction matters when a plant is deciding what to improve. If the process is stable but poorly centered, an offset adjustment, fixture correction, or better setup control may solve the problem. If the process is stable but too variable, the team may need to address tool wear, temperature, clamping, material behavior, or operator technique. If the process is unstable, investing in automation before removing special causes can automate an unreliable method.
The decision hiding behind the index
Process capability analysis compares the natural variation of a stable process with its specification limits. The principal short-term indices are Cp and Cpk. The related long-term performance indices are Pp and Ppk.
A useful way to think about the four indices is to separate two questions:
- How wide is the process spread? Cp and Pp answer this by comparing specification width with variation.
- How close is the process to a specification limit? Cpk and Ppk answer this by considering the process mean and the nearest limit.
That separation gives the manager an action, not just a score. A large Cp with a materially smaller Cpk points toward centering. Low values for both point toward excessive variation. A gap between short-term capability and long-term performance signals that the process changes as shifts, lots, maintenance cycles, or environmental conditions change.
Capability analysis also belongs beside cost and production analysis, not in a quality report isolated from operations. A practical production cost analysis can help connect scrap, rework, labor dependency, downtime, and proposed equipment changes to the capability evidence.
By the end of a sound study, you should be able to decide whether to:
- Adjust the existing process.
- Improve tooling, fixtures, or work instructions.
- Retrofit the workstation with controls or error-proofing.
- Replace the process technology.
- Hold the automation decision until stability and measurement problems are resolved.
A capability index is useful only when it leads to a better production decision.
What Process Capability Analysis Actually Measures
Every process has a natural voice. Cutting forces, machine rigidity, material properties, temperature, clamping pressure, tool condition, and human technique create variation even when nobody has made an obvious mistake.
The customer or engineering team provides a contract. That contract is expressed through the lower specification limit, or LSL, and the upper specification limit, or USL. Parts outside those limits fail the requirement, regardless of whether the process appears visually consistent.
Capability analysis is the conversation between those two elements. It compares the process voice, represented by its variation, with the specification contract, represented by the tolerance band. The analysis is meaningful only when the process is stable and the distribution assumptions support the selected method.
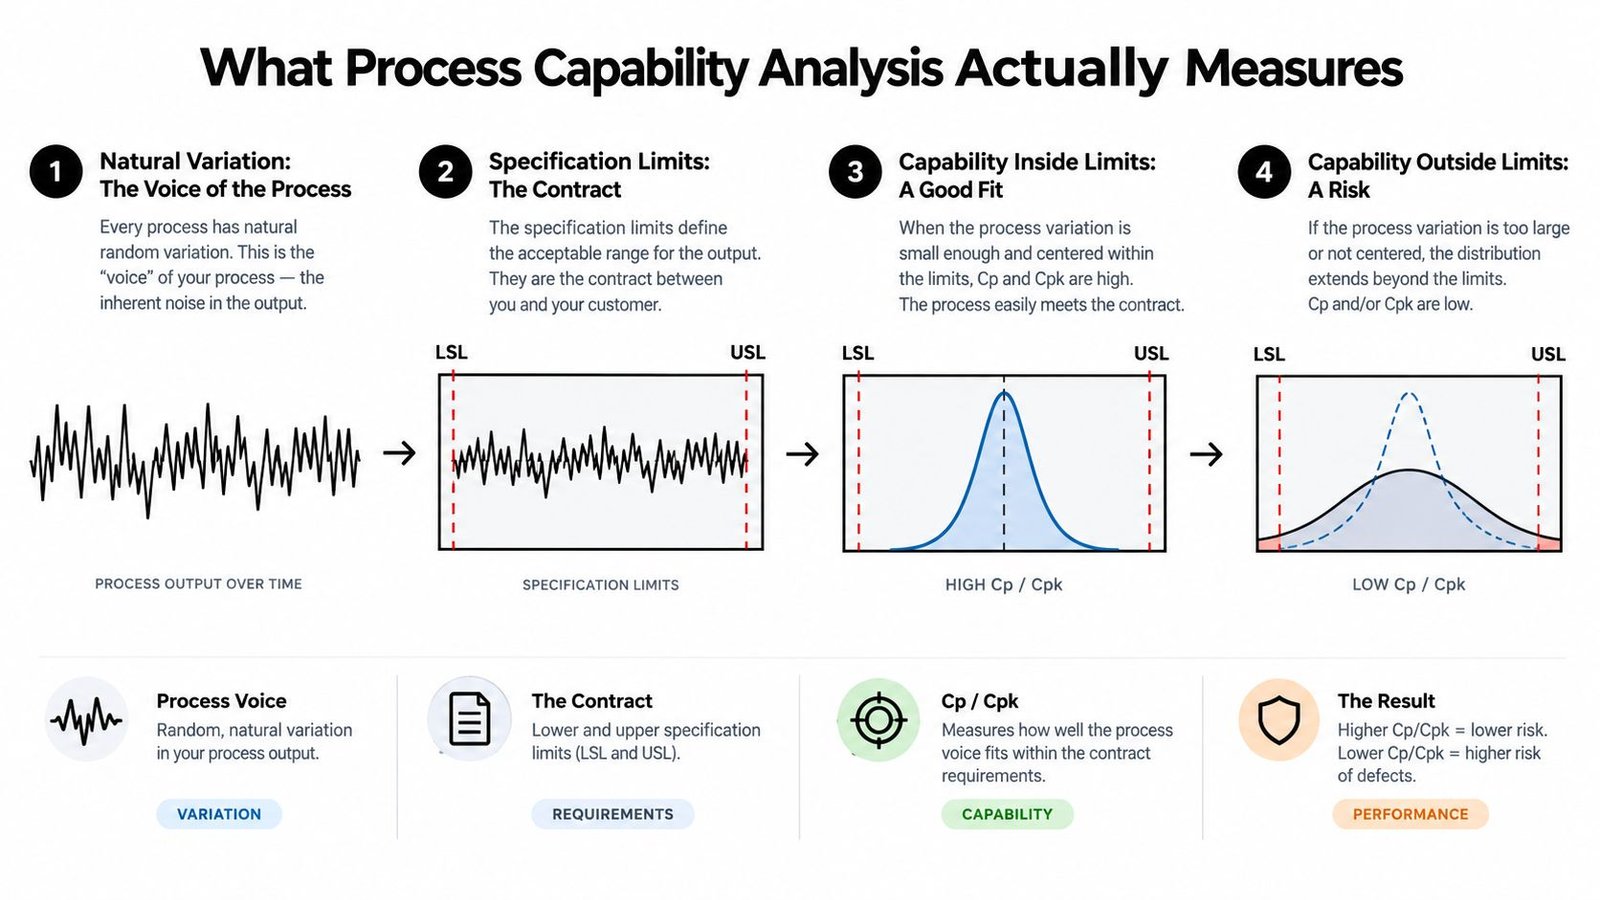
From spread to capability
For a two-sided specification, the main formulas are:
- Cp = (USL − LSL) / 6σ
- Cpk = min[(USL − μ) / 3σ, (μ − LSL) / 3σ]
Here, μ is the process mean and σ is the within-process standard deviation. Cp describes potential capability if the process is centered. Cpk describes realized capability, including the distance from the mean to the closer specification limit.
If Cp and Cpk are close, centering is probably not the dominant concern. If Cp is substantially larger than Cpk, the process spread may fit inside the tolerance, but the mean is too close to one side. That distinction tells the team whether to change the process target or reduce variation.
The ASQ process capability reference describes capability as the extent to which a stable process meets customer specifications. That wording is important. Capability isn't a property of a machine in isolation. It's a conclusion about a defined process operating under defined conditions.
The same logic applies to Pp and Ppk, but those indices use overall, long-term variation. They reveal what happens when the study includes the changes that short-term subgroup measurements may miss.
Central idea: Variation is information. Capability analysis translates that information into a decision about whether the process can meet the specification.
The result isn't a substitute for engineering judgment. It should be considered with the measurement system, control-chart behavior, sampling plan, product risk, and intended production conditions.
The video below provides another visual explanation of the relationship between process variation and specification limits.
Cp, Cpk, Pp, and Ppk Explained Without the Jargon
The four indices become easier to remember when you separate short-term variation from overall variation, and potential capability from actual centering.
Cp uses within-subgroup variation and assumes the process is centered. It answers, “How well could this process fit inside the tolerance if the mean were positioned ideally?”
Cpk also uses within-subgroup variation, but it checks the distance from the mean to both specification limits and uses the smaller distance. It answers, “How well is this process performing in the short term?”
Pp uses overall standard deviation and assumes centering. It describes long-term potential performance.
Ppk uses overall standard deviation and includes centering. It is the long-term counterpart to Cpk and often provides the more realistic warning when conditions change over time.
| Index | Formula | σ used | What it tells you |
|---|---|---|---|
| Cp | (USL − LSL) / 6σ | Within-process | Potential short-term capability if centered |
| Cpk | min[(USL − μ) / 3σ, (μ − LSL) / 3σ] | Within-process | Realized short-term capability and the weaker specification side |
| Pp | (USL − LSL) / 6σ | Overall | Potential long-term performance if centered |
| Ppk | min[(USL − μ) / 3σ, (μ − LSL) / 3σ] | Overall | Realized long-term performance and centering |
Reading the gap
A process with Cp = 1.33 has a specification width equal to 8σ, so its short-term spread fits inside the tolerance band with margin if the process is centered. That doesn't guarantee acceptable production, because the mean may be displaced.
If Cp is strong but Cpk is materially lower, adjust the process center before redesigning the entire operation. Machine offsets, fixture location, tool position, and setup instructions are likely candidates.
If both Cp and Cpk are low, the process spread is too wide. Look for tool wear, temperature changes, clamping variation, material differences, or inconsistent operator technique. The right intervention may be process improvement rather than automation.
A useful interpretation is qualitative rather than automatic:
- Cpk below the customer or engineering requirement indicates that release is not justified.
- Cpk close to the required boundary calls for caution, confidence intervals, and representative production data.
- Cpk at or above 1.33 is commonly treated as a capable benchmark for a stable process, but the applicable requirement must come from the customer, design authority, or quality system.
- Critical characteristics may require a more conservative internal target, especially in medical-device production.
The Six Sigma tools and techniques overview can help teams place capability analysis alongside control charts, root-cause analysis, and structured improvement methods. The index doesn't tell you which tool to use. It tells you where the process needs attention.
Data, Sampling, and the Prerequisites That Change the Answer
A capability number is only as credible as the conditions behind it. Before quoting Cp or Cpk, confirm four foundations: the process is stable, the data is suitable for the method, the sample is large enough to support a useful estimate, and the measurement system can distinguish part variation from measurement noise.
Stability comes first
Use an appropriate control chart, such as an Xbar/R chart for rational subgroups or an individuals chart when measurements are collected one at a time. Special-cause shifts can conceal instability and produce misleading capability estimates. A process with an unresolved tool change, material transition, or fixture issue shouldn't be summarized as if it were predictable.
Normality also matters for the classic formulas. If the data is strongly skewed or has unusual tails, investigate the physical process and select a method suited to the distribution rather than forcing a normal model.
The measurement system deserves the same scrutiny. A weak gage can add noise to the measurements, making the process appear more variable than it is. Before authorizing tooling changes or a workstation retrofit, complete an appropriate measurement-system analysis, including Gage R&R where applicable. See this guide to measurement system analysis for the operational role of that check.
Sampling must represent production
The data should reflect the conditions the line will face, not only the best part of a controlled trial. Stratify the study when equipment, operator, cavity, material lot, shift, maintenance condition, or time of day could affect the result.
NIST notes that at least 33 distinct repetitions are needed for an approximate 95% confidence interval around Cp or Cpk with roughly ±25% precision under the stated assumptions. That doesn't mean every production study should stop at that point. It means managers should recognize that capability indices are estimates with uncertainty, not exact properties of the process. See the NIST statistical glossary for the underlying capability definitions and assumptions.
A practical sampling checklist looks like this:
- Use consecutive parts when estimating within-subgroup variation under nearly unchanged conditions.
- Stratify by cavity or machine when multiple sources can behave differently.
- Include shifts and lots when the decision concerns normal production, not a single controlled run.
- Record context such as operator, tool condition, material, setup, and maintenance status.
- Report confidence intervals before using capability results to justify automation, tooling changes, or process release.
The key distinction is simple. Cp and Cpk focus on within-subgroup, short-term variation. Pp and Ppk use pooled overall variation and therefore include more time-dependent behavior. A station can look strong during a controlled trial and show weaker long-term performance after real production conditions are included.
Worked Examples From a Shop Floor and a Cleanroom
Consider a semi-automated assembly station that presses a bushing into a housing. The team wants to know whether the current station needs a complete replacement or whether a better fixture, depth sensor, and controlled adjustment would be enough.
The first question isn't the index. The team checks the measurement system, plots the observations in time order, and verifies that the process is stable. If the short-term spread fits inside the specification and the mean sits comfortably away from both limits, a targeted retrofit may address the remaining risk.
A stable assembly process
A stable assembly station with a centered process presents a very different decision from a drifting one. A capable short-term result combined with a reasonably strong long-term result suggests that the underlying method is sound. The improvement opportunity may be repeatability, error-proofing, cycle-time reduction, or labor relief rather than a wholesale technology change.
In that situation, the manager can ask:
- Can a fixture constrain part orientation?
- Can a sensor confirm seating depth before release?
- Can controls prevent an out-of-position cycle?
- Can the existing station accept a validated retrofit without disrupting production?
Those questions translate capability evidence into an engineering scope.
An unstable medical-device process
Now consider a medical-device extrusion line producing tubing with a tight diameter requirement. The process may show an acceptable average during a short run while tool condition, temperature, material behavior, or line speed changes later. If the range chart shows a special-cause pattern, the capability result isn't ready for an automation decision.
The correct response is to investigate the cause, restore stability, and collect representative data again. In a GMP-aware environment, the team must also consider documented change control, validation impact, traceability, and the effect of any new sensor, fixture, control strategy, or workstation sequence.
| Metric | Assembly station, stable | Medical-device line, unstable |
|---|---|---|
| Control-chart status | Stable behavior supports capability interpretation | Special-cause behavior makes the estimate unreliable |
| Short-term question | Does the process spread fit the tolerance? | The spread cannot be trusted until instability is resolved |
| Long-term question | Do shifts, lots, and maintenance change performance? | The process may behave differently outside the trial |
| Likely first action | Evaluate tooling, fixturing, sensing, or error-proofing | Identify and remove the special cause |
| Automation decision | Retrofit may be appropriate if risk and validation support it | Hold the retrofit or replacement decision |
The contrast matters because automation can improve consistency, but it can't automatically correct an unstable process. A control system may detect a drift, yet the plant still needs a defined response, validated limits, and a root-cause plan.
Common Pitfalls That Make Capability Numbers Lie
Capability indices create false confidence when teams treat them as independent of the process that produced the data. The most expensive mistakes usually happen before the formula is calculated.
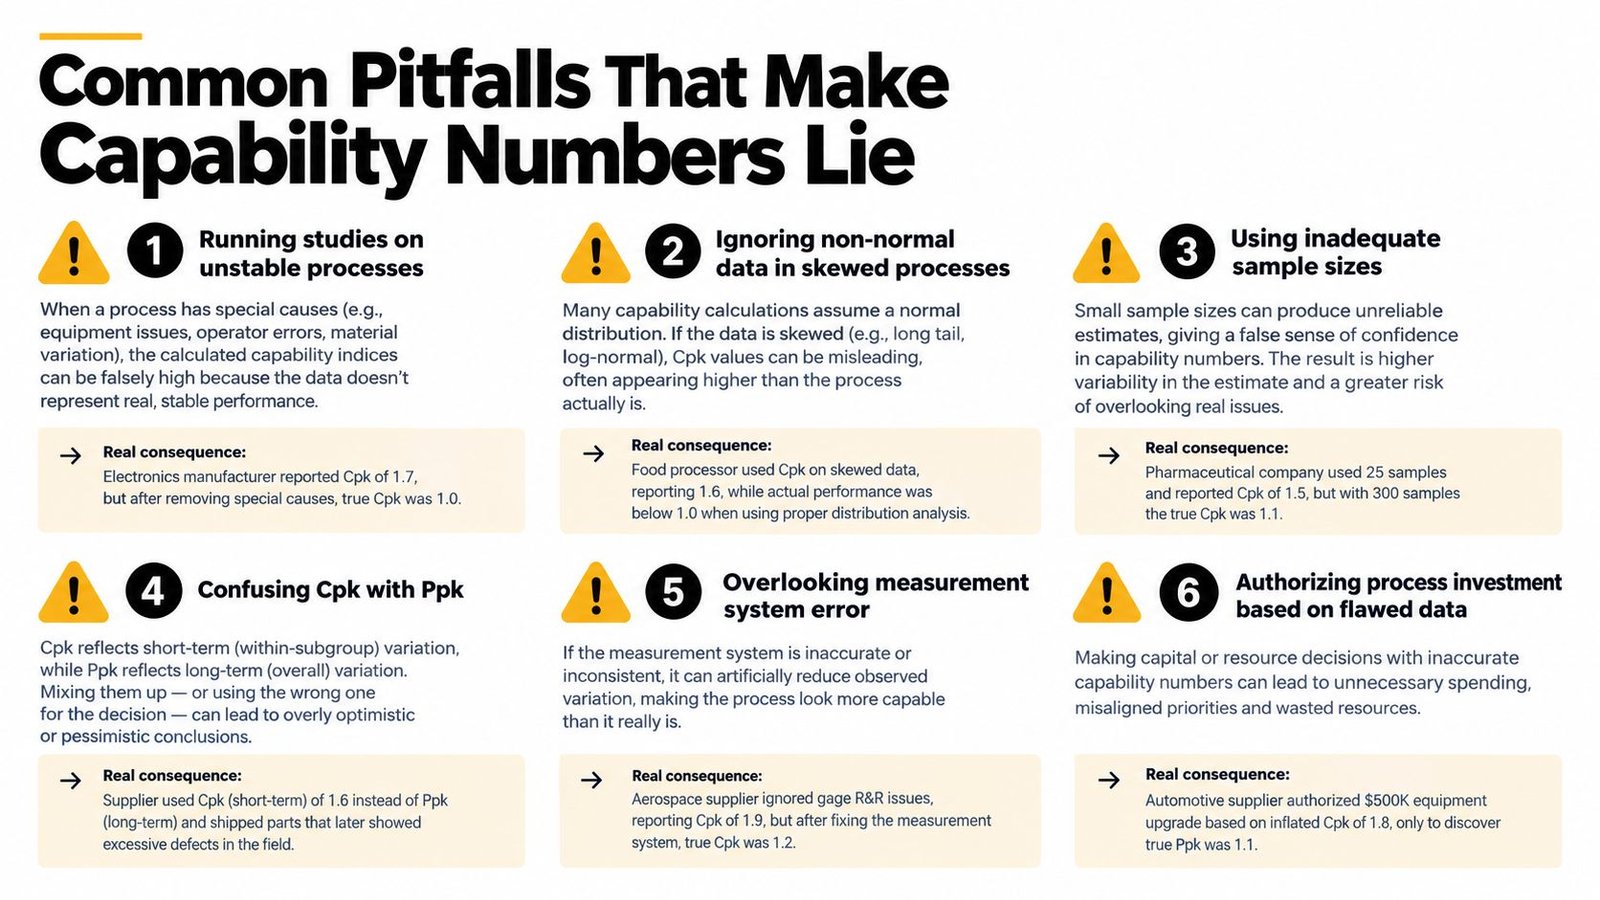
The errors behind bad decisions
Running the study on an unstable process mixes ordinary variation with special-cause shifts. The resulting index may describe no real operating state. Fix the source of the shift, then restart the study.
Ignoring non-normal data can make the standard formulas misleading. Skewed dimensions, bounded measurements, and processes with unusual tails need investigation before a normal capability calculation is accepted.
Using too little data creates wide uncertainty around the estimate. A short pilot can be useful for learning, but it can't demonstrate how the process behaves across the conditions that matter to production.
Confusing Cpk with Ppk hides the difference between a controlled trial and long-term operation. Cp and Cpk use within-subgroup variation. Pp and Ppk use overall variation. Mixing those inputs produces an answer that appears precise but has no clear operational meaning.
Overlooking measurement error can either inflate or obscure the apparent process variation. If operators measure differently or the instrument lacks adequate repeatability, the team may adjust a process that was not the source of the issue.
Analyzing only the convenient side of the tolerance leaves risk at the unused limit. Cpk specifically checks the nearer specification side, so both USL and LSL must be verified and included when the characteristic has two-sided requirements.
Practical rule: Never approve an equipment investment from a capability index that lacks a stable control chart, a defensible sampling plan, and a trustworthy measurement system.
These pitfalls have practical consequences. A plant can scrap a launch, face an audit finding, or retrofit a workstation that never delivers the expected return. The number may look authoritative, while the decision built on it remains weak.
From Capability Results to the Right Automation Decision
Capability analysis becomes valuable when it changes what the operations manager does next. The result should separate a centering problem from a variation problem, and both from a stability problem.
A stable process with strong short-term capability and acceptable long-term performance may not need full automation. Better fixtures, controlled tooling, sensors, or error-proofing can preserve a sound method while reducing manual dependency.
A large gap between Cpk and Ppk, or between short-term and long-term results, calls for investigation before equipment selection. The process may be sensitive to shifts, lots, maintenance cycles, or environmental conditions. Automating that instability without addressing its cause can make the line more complex without making it more capable.
A four-step decision sequence
- Verify stability. Confirm that the control chart shows predictable behavior and that special causes have been addressed.
- Calculate both views. Use within-subgroup variation for Cp and Cpk, then examine overall variation through Pp and Ppk.
- Map the result to an intervention. Decide whether the issue is centering, dispersion, long-term drift, measurement, or fundamental process design.
- Pilot the selected change. Test the fixture, sensor, control, or retrofit under representative conditions, then repeat the stability and capability review.
| Capability profile | What it tells you | Recommended action |
|---|---|---|
| Stable, strong Cp and Cpk, with similar long-term results | The process fits the tolerance and remains reasonably consistent | Consider tooling, fixturing, sensing, or semi-automation |
| Strong Cp but materially lower Cpk | Spread may be acceptable, but the process is poorly centered | Correct offsets, setup, targeting, or fixture position |
| Low Cp and low Cpk | Variation is too wide, regardless of centering | Reduce dominant sources of variation before automating |
| Strong short-term indices but weaker Pp and Ppk | Long-term conditions are degrading performance | Investigate shifts, lots, maintenance, and environment |
| Unstable control chart | The process isn't predictable enough for release or investment | Remove special causes and repeat the study |
| Unreliable measurement system | The data can't support a sound capability conclusion | Improve the gage, method, fixture, or measurement procedure |
For semi-automated and medical-device lines, the right level of automation often sits between manual work and a full replacement. A validated fixture can control orientation. A sensor can confirm a critical condition. A simple interlock can prevent the next operation when a part is out of position. These changes may improve the process without forcing the plant into an unnecessarily rigid architecture.
The final scope should account for production goals, quality risk, validation requirements, maintenance access, operator interaction, and future flexibility. Capability analysis doesn't choose the equipment by itself. It gives engineering and operations a disciplined basis for choosing what the equipment must control.
System Engineering & Automation offers custom tooling, fixtures, semi-automatic systems, integrated controls, and GMP-aware engineering support for manufacturers that need a practical path from capability results to production improvement. Visit System Engineering & Automation to discuss a retrofit, workstation upgrade, or automation concept built around your process data and operating constraints.