Wednesday at 7:40 a.m., the line is supposed to start at 8:00, and a preventive work order is already overdue. Production wants one more run before you shut anything down. Maintenance knows the bearing noise is getting worse. Quality is watching startup scrap. Nobody is arguing about whether the work matters. The fight is about whether the plant will protect the time to do it.
That's where most equipment maintenance schedules fail. Not in the spreadsheet. Not in the CMMS. They fail on the floor, when planned work meets output pressure and planned work loses.
For small and mid-sized manufacturers running semi-automated equipment, this gets even messier. You don't have endless spare labor, duplicate lines, or a reliability department with its own analyst. You have a filler, capper, labeler, conveyors, tooling, sensors, maybe a vision system, and a short list of people who know how to keep all of it alive. If you're trying to optimize production and service without overbuilding the solution, your schedule has to survive real production conditions, not ideal ones.
Table of Contents
- Why Most Maintenance Schedules Break Before They Start
- Ranking Assets by Criticality Before You Schedule Anything
- Preventive vs Predictive Tasks and When to Use Each
- A Frequency Template You Can Apply This Week
- KPIs That Prove the Schedule Is Actually Working
- Commissioning Handover as the Foundation of Every Schedule
- Three Rules to Protect Maintenance Windows From Production Pressure
Why Most Maintenance Schedules Break Before They Start
Most schedules don't break because the idea is wrong. They break because the schedule was written as a task list, not as an operating agreement between maintenance and production.
A basic preventive maintenance schedule matters because waiting for failure is expensive. The U.S. National Institute of Standards and Technology estimated $119.1 billion in losses from preventable maintenance issues in 2016, including $18.1 billion from downtime, $0.8 billion from defects, and $100.2 billion from lost sales tied to delays and defects, as summarized in maintenance statistics and trends. That tells you the damage doesn't stop at the repair itself. It spills into output, quality, and customer delivery.
Four failure points that show up early
The first problem is no criticality ranking. Everything lands on the same PM board. A conveyor with easy bypass gets treated like the filler that sets line pace. When production pushes back, nobody knows which job is untouchable and which one can move.
The second is copying OEM tasks without plant context. OEM manuals are useful, but they don't know your duty cycle, washdown pattern, product changeovers, or operator habits. I've seen plants rebuild assemblies early because the manual said so, even though the actual wear pattern didn't justify it. That burns labor and parts without improving reliability.
The third is borrowing frequencies from another plant. A peer running one shift on dry product won't have the same schedule as a line running longer hours with frequent cleaning and stop-start cycles. One site changes filters or seals too early. Another changes sensors too late and pays in scrap, nuisance faults, and rushed troubleshooting.
Practical rule: If your schedule was copied from a manual, another facility, or the last person's spreadsheet, assume it's only a draft.
The fourth is the one most articles skip. There's no enforcement mechanism when production squeezes the week. MaintainX's 2025 survey found that 71% of leaders say preventive maintenance is a core strategy, yet 58% of facilities spend less than half their maintenance time on planned maintenance, and fewer than 35% spend most of their time on planned tasks, as cited in The State of Industrial Maintenance 2025. That gap is the story. Plants know PM matters. They still let reactive work push it out.
What survives on the floor
A workable equipment maintenance schedule has to do more than assign dates. It has to define criticality, choose the right task type for each failure mode, set defendable frequencies, track outcomes that matter, pull clean data from commissioning handover, and lock maintenance windows tightly enough that operations can't override them casually.
If you don't build those protections in at the start, the schedule becomes paperwork with good intentions.
Ranking Assets by Criticality Before You Schedule Anything
A PM schedule usually gets cut at the same point every week. It is not the low-value utility skid in the corner. It is the line asset operations cannot afford to stop, which is exactly why criticality has to be settled before anyone starts assigning frequencies.
On a semi-automated line, I start with one question: if this asset drops out for 20 minutes, what happens to throughput, product quality, and recovery effort? That gives a more useful ranking than asset age, purchase price, or how recently it was installed.
Score the asset by operational consequence
Use three scoring factors and keep them plain enough that production, maintenance, and QA can all argue about the same sheet.
- Throughput impact. Does this stop the bottleneck, starve or block the line, or just slow one section?
- Quality or compliance exposure. Can the failure create bad seals, wrong labels, missed inspection, rejected batches, or a GMP documentation problem?
- Recovery effort. How long does it take to diagnose, repair, set back up, verify product, clear rejects, and release the line again?
That third point gets missed all the time. A fault that takes five minutes to fix but 45 minutes to clean up, recheck, and restart belongs higher on the list than the maintenance log may suggest.
A low-cost device can sit near the top. A photoeye tied to reject confirmation, a barcode scanner tied to traceability, or an air prep unit feeding several actuators often matters more than a more expensive standalone support asset.
Use simple tiers that production can understand
Small and mid-sized manufacturers do not need a reliability engineer to build a workable ranking model. An A/B/C tier is enough if the definitions are tight.
- Tier A assets stop shipment, control the bottleneck, create serious quality risk, or require a long and messy recovery.
- Tier B assets reduce rate, increase operator intervention, create intermittent waste, or cause short stoppages that pile up over a shift.
- Tier C assets have limited local impact, a quick swap path, or a practical workaround.
Once assets are tiered, the schedule gets easier to defend. Tier A equipment gets protected PM windows, firmer override rules, tighter spare coverage, and cleaner records. Tier C equipment can stay on lighter routines, and some items can run to failure if replacement is fast and the failure does not create safety or quality exposure.
Plants that rank by replacement cost usually over-service support equipment and under-protect the assets that actually govern output.
Sample Criticality Scoring Worksheet
| Asset | Downtime Cost/Hour | Safety/Quality Risk | Recovery Difficulty | Tier |
|---|---|---|---|---|
| Filler | High | High | High | A |
| Capper | High | High | Medium | A |
| Labeler | Medium | High | Medium | B |
| Vision System | Medium | High | Medium | B |
| Main Conveyor | Medium | Medium | Low to Medium | B |
| Case Packer | Medium | Medium | Medium | B |
| Spare Transfer Pump | Low | Low | Low | C |
Be honest about downtime cost
For the cost score, do the arithmetic from the floor, not from finance slides. Count lost output, labor still standing there, scrap or rework created during the event, and the extra time needed to get back to a releasable state. On regulated lines, include the documentation burden if a failure creates hold product or label reconciliation work.
Analysts at Mapcon noted that unplanned downtime often carries large hourly losses across manufacturing sectors, and they cite especially high costs in fast-moving consumer goods and automotive operations. The exact benchmark is less important than the habit. Put numbers on stoppages and the ranking gets harder to argue with.
One caution. Do not score every asset as high just to protect maintenance time. If everything is Tier A, nothing is Tier A.
Add two fields that make the ranking usable
A one-page worksheet should do more than assign a letter grade. Add these fields:
- Shutdown requirement. Can the task be done during production, during a micro-stop, or only in a full planned window?
- Override authority. Who can delay this PM, and who must sign off if production wants the window back?
Those two fields are what turn a ranking exercise into something that survives contact with production. They also matter for GMP-controlled plants, where deferred work and temporary risk acceptance need a record that QA can follow later.
If a supervisor cannot tell which work orders are protected, which can slide a week, and which require formal approval to postpone, the criticality ranking is still unfinished.
Preventive vs Predictive Tasks and When to Use Each
A PM that only works on paper usually treats every task the same way. The line does not. Some failures follow wear. Others give warning through heat, vibration, current draw, nuisance faults, or drift long before a part breaks.
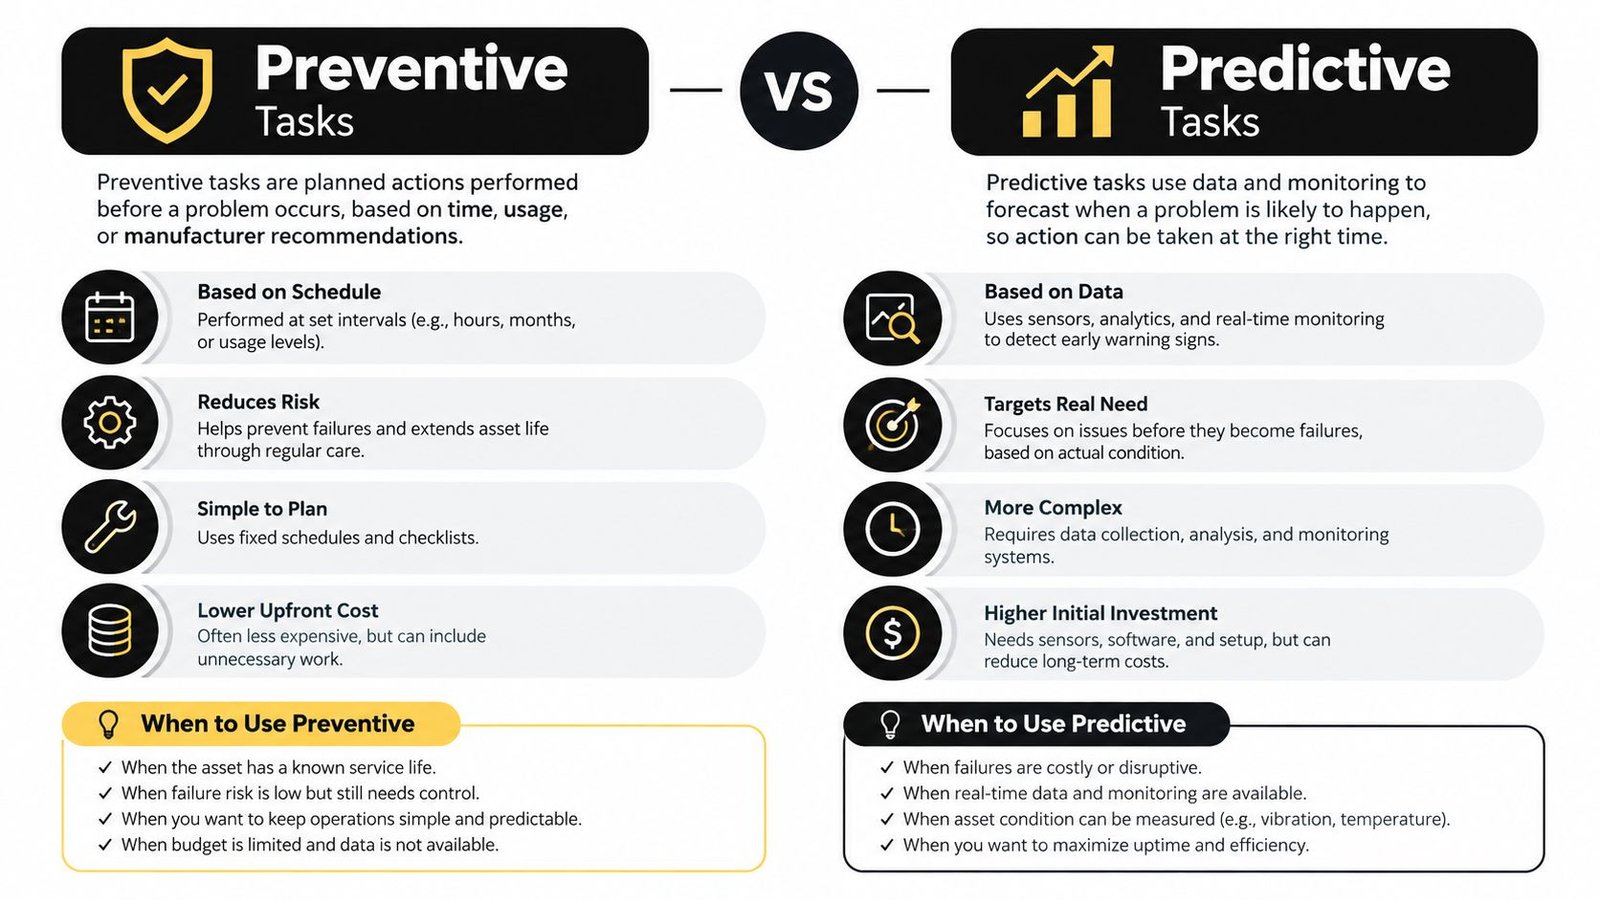
A preventive task runs on time, cycles, or batches. A predictive task runs on condition. The difference matters because the wrong method creates two problems at once. You either replace parts too early and waste scarce windows, or you wait for a failure that had clear warning signs.
Where preventive maintenance earns its keep
Preventive work belongs on items with a known wear pattern and a clean intervention. Lubrication, filter changes, belt replacement, seal replacement, torque verification, and scheduled calibration usually fit here. On small and mid-sized semi-automated lines, these are often the tasks that survive production pressure because they are easy to explain, easy to time, and easy to verify afterward.
Use preventive tasks when:
- The failure mode is well understood and age or use is a reasonable predictor.
- The task is cheaper than the failure, including cleanup, startup losses, and QA review if the asset touches product.
- The task supports safety, compliance, or GMP control, where proof of completion matters as much as the wrench time.
- The acceptance point is clear, such as torque reached, lubricant applied, filter changed, or calibration passed.
A capper cam bearing is a good example. If it starts to loosen up after a known number of hours and the changeout is straightforward, put it on a fixed interval and protect the window.
Where predictive monitoring pays off
Predictive methods earn their keep on assets that do not fail neatly by age. Servo drives, gearboxes under variable load, vacuum pumps, motors, and fans often tell you more through condition than through the calendar. A broad predictive maintenance research review links condition-based programs with lower maintenance and downtime costs when plants use the signals well.
The catch is execution. Adding sensors is easy compared with building a response process that production will respect. If nobody reviews the trend, sets action limits, or converts an alert into a protected work order, predictive maintenance turns into another dashboard people stop trusting.
Use predictive methods when:
- Failure is irregular or load-dependent.
- You can collect a signal that someone can act on, such as temperature, vibration, current, pressure decay, or fault frequency.
- The asset is expensive to lose and hard to recover once it trips.
- Your records can support condition-based decisions, especially on GMP lines where deferral and intervention need a clean rationale.
For teams setting that up, this practical guide to implementing predictive maintenance covers the basics without pretending every site needs a full analytics project.
Use the failure mode to pick the method
The cleanest rule is simple. If age causes the failure, use preventive maintenance. If condition reveals the failure better than age does, use predictive monitoring.
That sounds obvious, but it gets missed all the time during schedule reviews. Plants put monthly PMs on components that fail randomly, then wonder why the line still stops between intervals. They also overcomplicate basic wear items that only needed a disciplined replacement cycle.
A hybrid approach usually works best
On real equipment, the answer is often both.
Take a semi-automated capper. Keep bearings, seals, and wear parts on a preventive interval if the history is stable. Watch the servo drive and motor differently. Trend current, heat, fault resets, and instability during operation. That gives maintenance a reason to act before the drive fails, while keeping the mechanical rebuild work on a schedule production can plan around.
That hybrid model is usually the one that survives contact with operations. It also produces better records at handover and during audits because each task has a clear basis. Time-based where wear is known. Condition-based where evidence is stronger.
A Frequency Template You Can Apply This Week
Once criticality is set, frequencies become much easier to defend. You're no longer arguing over whether “monthly” sounds reasonable. You're matching task interval to asset tier, failure mode, and required skill.
For manufacturing plants, maintenance frequency is commonly tied to asset criticality and operating conditions. Critical production-line equipment may need daily visual checks, weekly detailed inspections, and monthly full service, while support equipment may only need monthly or quarterly attention, according to this manufacturing preventive maintenance checklist.
Start with this matrix
Use the table below as a working template, not gospel. It's meant for semi-automated equipment where operators handle basic checks and technicians handle adjustment, calibration, and component replacement.
| Criticality Tier | Task Category | Frequency | Duration (min) | Parts/Consumables | Acceptance Criteria |
|---|---|---|---|---|---|
| A | Visual inspection and abnormal noise check | Weekly | 10 to 20 | None | No leaks, abnormal heat, unusual noise, or loose hardware |
| A | Lubrication | Weekly or Monthly | 15 to 30 | OEM-specified lubricant | Correct lubricant applied at specified points, no over-greasing |
| A | Sensor verification | Weekly | 10 to 20 | Cleaning wipes, mounting hardware if needed | Reliable detection, stable indication, correct alignment |
| A | Belt tension and wear check | Monthly | 20 to 40 | Belt if replacement threshold is met | Tension within plant standard, no fraying or tracking issue |
| A | Calibration or setup verification | Monthly or Quarterly | 20 to 60 | Calibration tools, reference standard | Readings within approved process tolerance |
| A | Major service or rebuild item | Annual or usage-based | 60 plus | Bearings, seals, belts, kits | Component condition restored, startup checks passed |
| B | Visual inspection | Weekly | 10 to 15 | None | No visible deterioration or interference |
| B | Filter service | Monthly or Quarterly | 15 to 30 | Filters | Flow or pressure condition acceptable after change |
| B | Fastener and guard check | Monthly | 10 to 20 | Hardware as needed | Guards secure, no missing fasteners |
| B | Functional sensor check | Monthly | 10 to 15 | Cleaning materials | Device responds consistently under operating conditions |
| C | Basic inspection | Monthly | 10 | None | Asset available and safe |
| C | Clean, adjust, replace as needed | Quarterly or Run to Failure with spare | 10 to 30 | Low-cost spare components | Restored function without line impact |
Define who does what
An equipment maintenance schedule survives better when tasks are split by competence, not just by department.
- Operator-led checks work for cleaning photoeyes, checking leaks, confirming indicator status, and spotting obvious belt tracking issues.
- Technician tasks cover calibration, lockout work, component replacement, torque checks, and root-cause follow-up.
- Controls or automation support should own trending, fault review, backups, and recurring sensor or drive issues.
This is also where one practical support option can help. System Engineering & Automation provides semi-automatic systems, integrated controls, commissioning, and maintenance support, which fits plants that need schedule-ready equipment data and service without building a large internal automation team.
Here's a useful training aid for teams that need a visual walkthrough of maintenance basics before they finalize task ownership.
What not to leave vague
Include acceptance criteria in the task itself. “Inspect belt” is weak. “Inspect belt for fraying, tracking, and tension within plant standard” is enforceable. “Check sensor” is weak. “Verify repeatable detection and alignment after cleaning and bracket inspection” gives the technician a finish line.
After several months of failure history, revise the frequencies. The first version should be disciplined, not permanent.
KPIs That Prove the Schedule Is Actually Working
A maintenance schedule is working only if the line becomes easier to keep running. High PM completion can look good in the report while operators still lose production every shift to the same conveyor, the same sensor bracket, or the same drive fault.
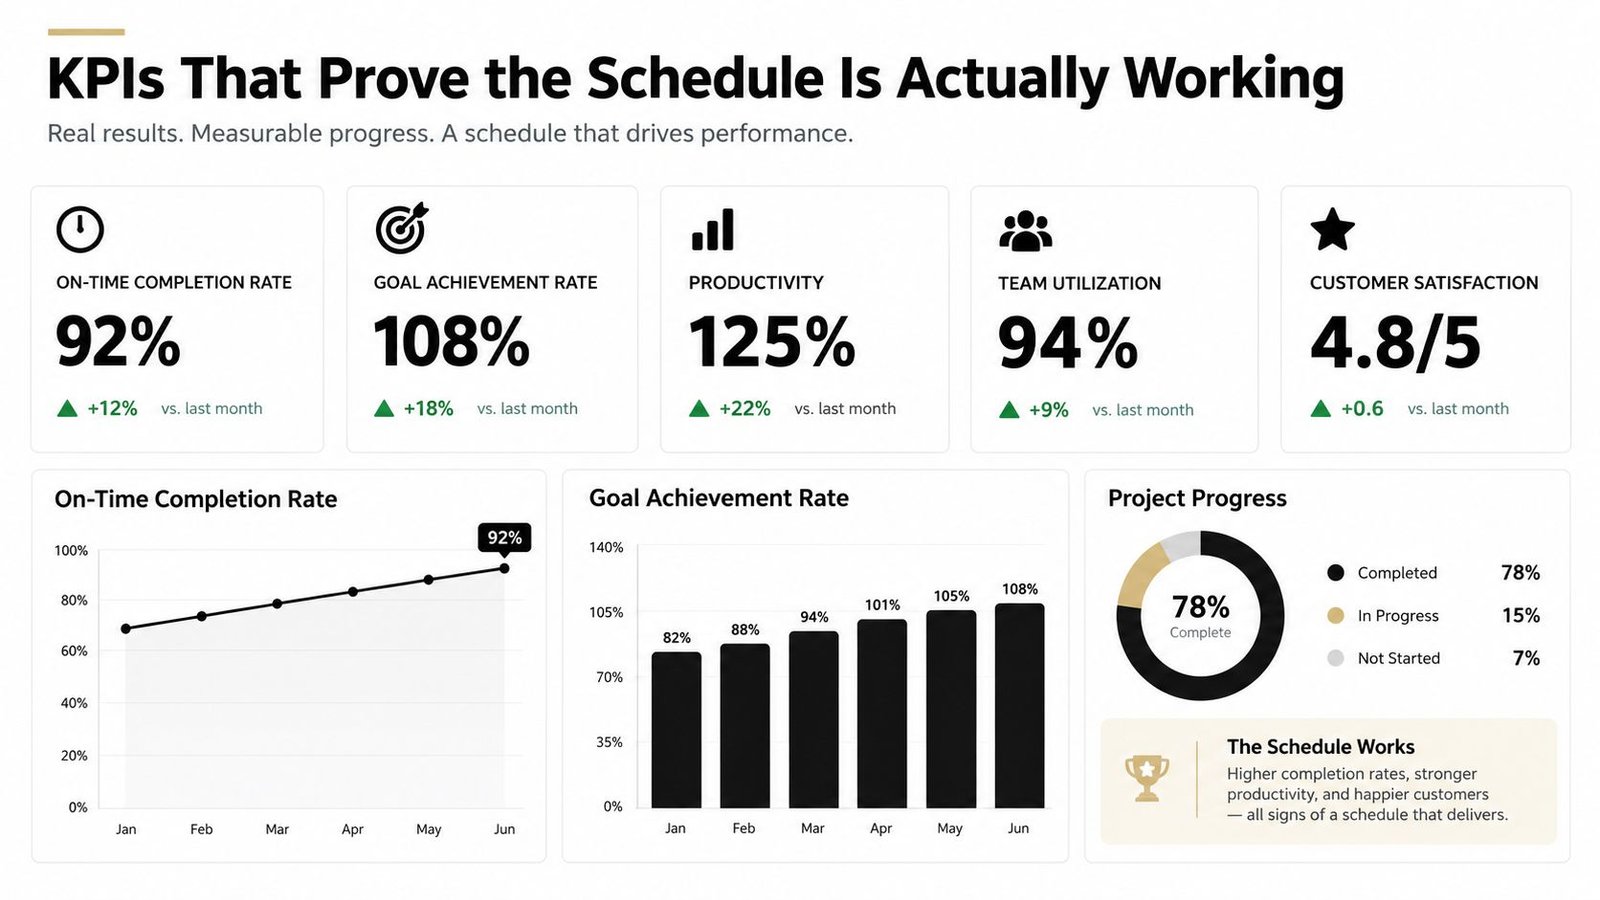
Track outcomes first. Use unplanned downtime hours, repeat failure count by asset, mean time to repair for chronic faults, and a rolling MTBF trend for critical equipment. Those measures show whether the schedule is preventing failures, shortening repairs, or just creating closed work orders.
Why PM compliance can fool you
I have seen filler lines report excellent PM completion and still stop three times a week on the same station. The reason was simple. The checklist covered lubrication, cleaning, and visual inspection, but it did not address the actual defect path. No one was checking coupling wear, alignment drift, or intermittent sensor mounts after washdown. The work got done. The risk stayed in place.
That is why PM compliance belongs in the review, but it should never lead the review. If downtime, repeat faults, scrap, or restart losses are flat, the schedule needs correction. For small and mid-sized plants, this matters even more because production pressure tends to protect output today and borrow trouble from next week.
KPI rules that survive real production pressure
- Track downtime by asset and failure mode. A line-level total hides the machine that keeps stealing your shift.
- Use rolling trends, not one-month snapshots. One major jam or one long parts delay can distort a short reporting window.
- Separate first-time failures from repeat failures. Repeat faults usually point to weak PM content, poor repair quality, missing spares, or an unresolved controls issue.
- Measure PM schedule adherence against the planned window. If work orders are always closed late because operations pushed them out, the problem is not technician discipline. It is schedule protection.
- Include quality impact where GMP applies. A maintenance program that reduces breakdowns but keeps causing setup drift, rejected packs, or documentation gaps is still failing the plant.
Scheduled compliance is a support metric. Reliability outcomes are the verdict.
Pull the data from what you already have
A mature CMMS helps, but it is not a requirement. Start with what the plant already records. Work order close codes, downtime logs, alarm history, operator comments, scrap tags, and quality deviations are usually enough to expose the pattern.
In GMP-regulated areas, records need to stand up to review, not just internal discussion. Link the maintenance event to the asset ID, symptom, failure mode, action taken, parts used, verification result, and who released the equipment back to production. If that chain is weak, chronic problems stay anecdotal and PM windows are the first thing operations will challenge.
Review the numbers monthly with maintenance, operations, and quality in the same room. Put delayed PMs beside the downtime and repeat-failure trend for the same assets. That changes the conversation. It stops sounding like maintenance asking for time and starts reading like a plant choosing where to accept risk.
Commissioning Handover as the Foundation of Every Schedule
The maintenance schedule should start before the line is handed over, not months later when the first avoidable failure forces the issue.
A complete industrial equipment maintenance schedule should include equipment identification, detailed task descriptions with acceptance criteria, frequencies or triggers, labor and parts requirements, assigned responsibilities, safety requirements such as permits and LOTO, documentation standards, and technical references like OEM manuals and procedures, as outlined in this industrial maintenance schedule guide. Most of that information already exists during commissioning. Plants just fail to turn it into living maintenance tasks.

What the schedule should inherit on day one
Pull these items directly from commissioning and qualification records:
- Lubricant specifications for each point and assembly
- Belt, sensor, filter, and wear-part numbers
- Torque settings for critical hardware
- Calibration certificates and approved setpoints
- Software backup snapshots for PLC, HMI, drives, and vision tools
- OEM service intervals and startup checks
- As-built drawings and I/O references
- Spare parts lists tied to criticality tier
In GMP-aware environments, this matters even more because the record trail has to support both maintenance execution and quality review. If a sensor affects reject confirmation, counting, label verification, or process interlocks, its maintenance history can't live in someone's notebook.
Build PM templates during validation, not after
The handover package should produce draft PMs immediately. Don't file the manuals, close the project, and assume maintenance will sort it out later. By then, the practical details get lost. Technicians end up guessing grease type, searching for backup files, or using old part numbers after the first urgent failure.
For teams involved in new equipment deployment, this overview of equipment commissioning is a useful companion to schedule planning.
If a new machine enters production without maintenance templates, the plant has postponed reliability work. It hasn't avoided it.
Keep the handover documents accessible inside the CMMS or linked work-order system. If a technician has to dig through shared drives during a shutdown, the process is already too slow.
Three Rules to Protect Maintenance Windows From Production Pressure
More PM doesn't automatically create more reliability. Plants often add tasks after every failure until the schedule becomes bloated, shallow, and easy for production to challenge. The result is predictable. Low-value work gets completed, high-value work gets deferred, and nobody trusts the calendar.
A better rule set is stricter, simpler, and easier to enforce.
Rule one ties the window to criticality
Create a signed capacity calendar with production planning and lock PM windows by asset tier. Tier A assets keep their windows unless a designated manager accepts the risk of an override. Tier B can move with formal review. Tier C can flex more freely.
This is the only way to stop every maintenance request from becoming a negotiation at shift start.
Rule two makes every deferral visible
If a PM is deferred, log the deferral, note the consequence, and assign the rescheduled date immediately. No verbal agreements. No “we'll catch it next week.” A deferred sensor verification on a quality-critical station is not the same as deferring a non-critical guard hardware check. The log should show that difference.
Independent reporting still shows many plants remain dominated by unplanned work, while stronger programs are benchmarked at 85 to 92% schedule compliance and 90%+ planned maintenance percentage, as discussed in the global manufacturing maintenance report. The lesson isn't that every plant should chase a benchmark. It's that execution discipline matters as much as maintenance strategy.
Rule three blocks unmanaged asset growth
No new asset should enter service without a draft schedule and an assigned owner. That includes tooling, semi-automatic workstations, sensors tied to quality decisions, and integrated control hardware. Otherwise the plant keeps adding maintenance demand without adding structure, and the existing PM pool gets diluted.
A 2024 industry analysis cited in maintenance reporting found that the average large manufacturing plant loses $253 million per year from unplanned downtime, experiences 25 unplanned downtime incidents per month, and totals 326 hours of downtime annually. The same reporting noted that 58% of facilities spend less than half their time on scheduled maintenance, and fewer than 35% spend a majority of maintenance time on preventive tasks, according to maintenance reliability industry statistics. That pattern should sound familiar. The issue usually isn't lack of awareness. It's lack of protected execution.
If your current equipment maintenance schedule keeps slipping, don't start by adding more PMs. Start by deciding which windows are untouchable, which deferrals require accountability, and which assets aren't allowed onto the floor without maintenance ownership.
If your plant is upgrading semi-automated equipment, adding controls, or trying to build a maintenance routine that survives production pressure, System Engineering & Automation can help with the practical pieces that usually get missed: commissioning-ready documentation, integrated controls support, GMP-aware records, and maintenance planning tied to real operating conditions. Visit System Engineering & Automation to see how SEA supports manufacturers that need cost-effective production solutions and dependable service after equipment goes live.