At 9 a.m., the production manager walks onto the floor with a clipboard and three conflicting versions of last night's output. The operator log says the line stopped twice. The PLC history suggests several short interruptions. Quality has quarantined a batch, but nobody can tie the hold to a specific machine event without searching through paperwork.
That situation is common in small and mid-sized plants. The machines are producing data, but the business can't trust it quickly enough to act. Production monitoring systems solve that gap by turning machine activity, operator input, downtime, and quality results into a usable operating picture. The hard part isn't buying a dashboard. It's connecting mixed equipment, validating the data, and introducing the system in phases that respect real production priorities.
Table of Contents
- What a Production Monitoring System Actually Does on a Shop Floor
- The Building Blocks from Sensor to Dashboard
- The Five KPIs That Actually Move Production Numbers
- How Data Flows from Machine to Decision
- Rolling Out Without Burning the Budget
- GMP, Medical Devices, and Audit-Ready Data
- Why Monitoring Projects Quietly Fail
- A Practical Selection and Implementation Checklist
What a Production Monitoring System Actually Does on a Shop Floor
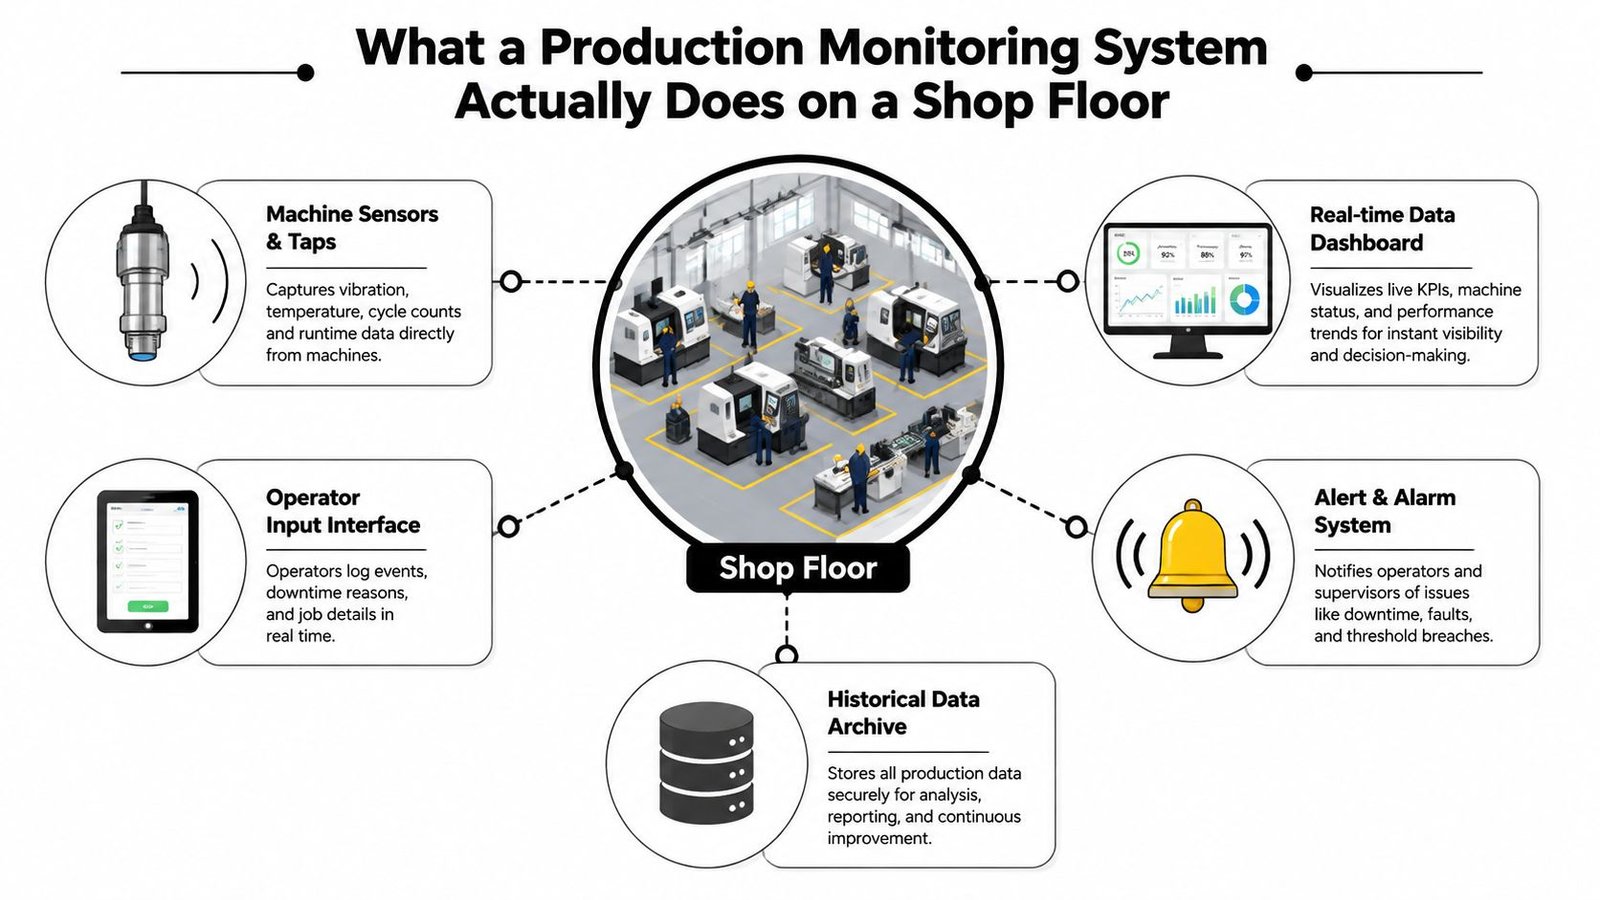
A production monitoring system is the working layer between the equipment and the people responsible for output. It collects signals from machines, combines them with operator-entered information and quality outcomes, then presents the result as current, structured production data.
That definition matters because a dashboard alone isn't a monitoring system. A screen showing green and red tiles may look modern while the underlying counts remain incomplete, downtime reasons remain vague, and operators still reconcile everything at the end of the shift.
The problem it removes
A useful system answers practical questions while there's still time to respond:
- What is running: Machine state, cycle activity, and output counts show whether the line is producing as planned.
- What stopped: Timestamped downtime events separate changeovers, material shortages, mechanical faults, maintenance, and quality holds.
- What was accepted: Quality results connect production activity to good and rejected output.
- Who needs to act: Operators see current exceptions, maintenance sees recurring faults, supervisors see shift performance, and managers see patterns across lines.
Production monitoring developed from manual production logs and punch-card tracking in the 1960s and 1970s toward integrated systems structured around manufacturing execution system concepts after the ISA-95 history and evolution of MES became established in 1995. That shift moved plants from isolated reporting toward formal data integration across planning, execution, and control.
Modern systems typically track machine state, cycle times, output counts, downtime events, and quality data in real time, rather than waiting for end-of-shift paperwork. For a plant manager, that means a recurring six-minute stop can be investigated during the shift instead of becoming an unexplained variance in the morning meeting.
Why the decision is practical now
Labor pressure, quality expectations, and energy costs make guesswork harder to defend in 2026. Smaller manufacturers don't need a factory-wide digital transformation program to respond. They need a reliable view of one bottleneck, a clear loss classification process, and a rollout plan that proves value before expanding.
The right starting question is not which dashboard has the most features. It's whether the system can create trusted data from the machines already on the floor. A focused machine monitoring software solution should fit the plant's existing controls, workflows, and budget instead of forcing a complete replacement of workable equipment.
Practical rule: If operators still have to reconstruct the shift manually, the plant doesn't have visibility. It has paperwork with a delay.
The Building Blocks from Sensor to Dashboard
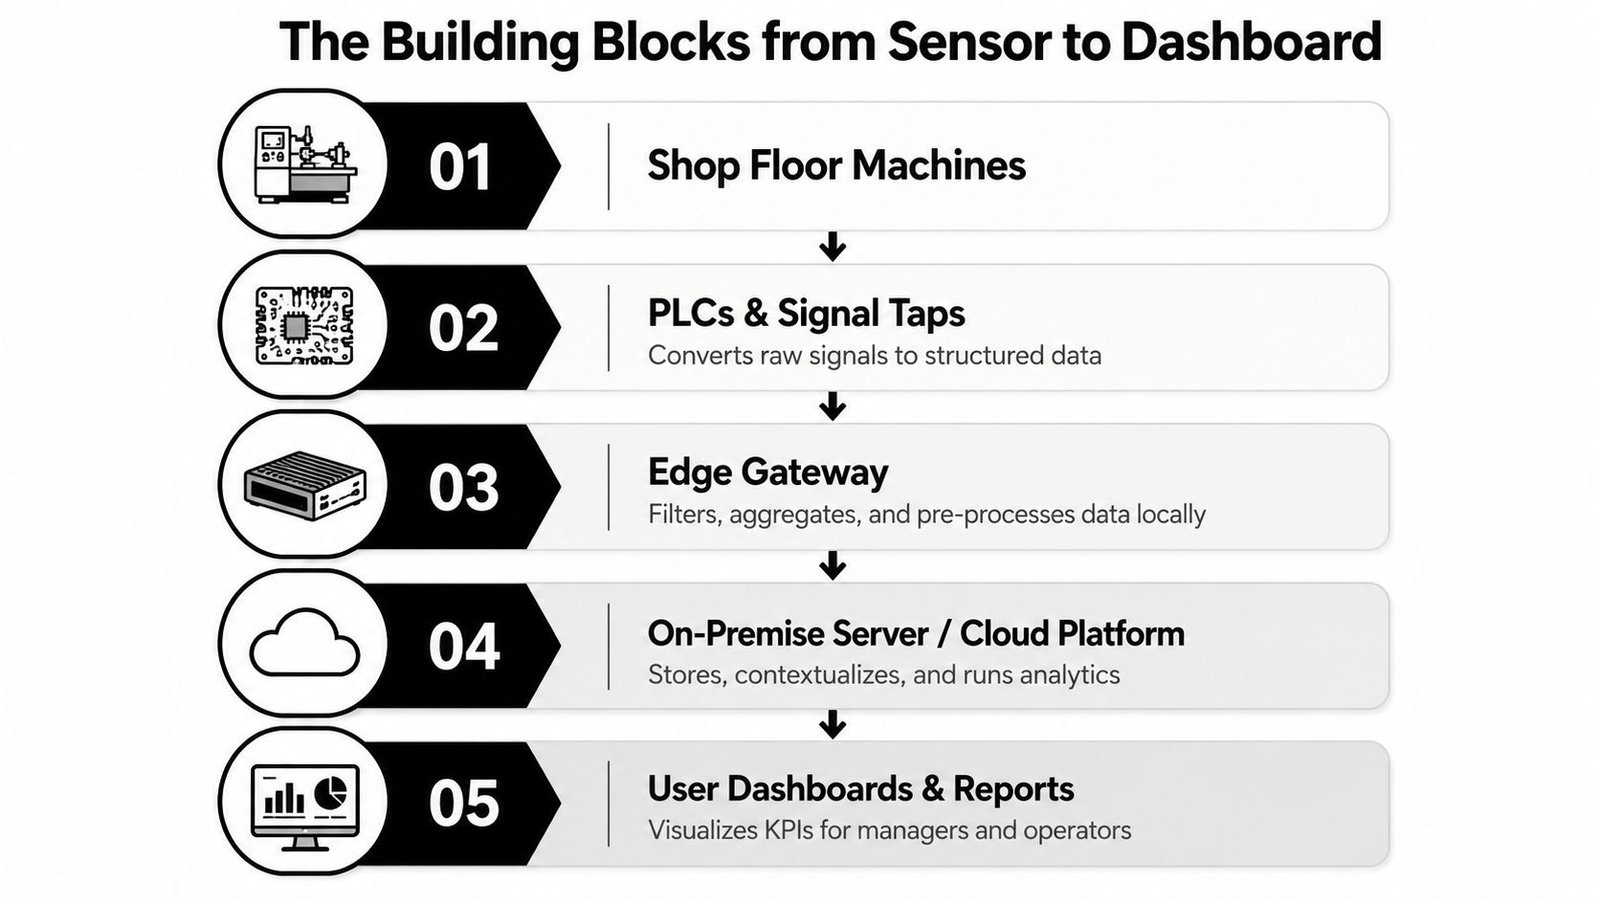
The monitoring stack works like a nervous system running through the line, with sensors, PLCs, and gateways each handling a different layer of signal processing. MES adds production context, while ERP connects that context to orders, materials, and business planning. The practical test is whether the stack turns mixed machine signals and manual inputs into trustworthy events that supervisors can act on.
Follow one assembly line making a repeated component.
Start with the machine
The first layer is physical. Existing sensors may already detect part presence, motor current, temperature, pressure, position, or completed cycles. A signal tap can read PLC information without changing the machine's core control logic, which makes it a sensible starting point for budget-constrained plants.
Add a sensor only when the available data cannot answer a production question, such as why the machine completes cycles without producing an accepted part. Extra instrumentation creates installation work and another signal to maintain, so it must resolve a defined information gap.
Use the PLC data that already exists
The PLC often contains the most useful immediate signals:
- Cycle bits indicate when a machine begins or completes an operation.
- Counters record parts produced or rejected.
- State signals identify running, idle, faulted, setup, or stopped conditions.
- Alarm tags provide context that a simple electrical signal cannot.
This layer turns electrical behavior into structured production events. If a counter resets unexpectedly or a state tag is poorly defined, the monitoring system will report bad information consistently. Validate tag meanings, transitions, and reset behavior before building dashboards around them.
Put the edge close to the line
An edge gateway gathers equipment signals and translates industrial protocols such as OPC UA and MQTT. It can filter noise, aggregate high-frequency events, buffer data during a network interruption, and forward only useful information to higher systems.
Keep this layer near the equipment. A reject signal, alarm, or stop classification should not depend on a remote service when the line needs an immediate response. Local buffering also prevents a temporary connection failure from erasing the shift record.
Add context with SCADA, MES, and ERP
SCADA gives supervisors a view of equipment and process conditions. MES adds work-order, routing, batch, labor, and production-sequence context. ERP provides the broader business record, including orders, materials, and planned requirements.
These systems have separate jobs. SCADA answers, “What is happening to the equipment?” MES answers, “What job and process is running?” ERP answers, “Why is this job required, and how does it fit the business plan?”
Architecture advice: Keep control logic in the PLC, immediate event handling at the edge, production context in MES, and business planning in ERP. A dashboard should expose gaps between those layers, not replace them.
The Five KPIs That Actually Move Production Numbers
Most plants track too many metrics and act on too few. Start with five line-level KPIs: availability, performance, quality, OEE, and first-pass yield. Each should lead to a decision on the next shift.
Availability
Availability measures the share of planned production time that equipment is running, consistent with the ISO 22400 OEE definition and manufacturing dashboard example. If a line has scheduled production time but spends it in breakdown, changeover, or material waiting, availability exposes the loss.
The action is not “improve availability.” The action is to rank downtime by duration and frequency, then remove the largest controllable cause.
Performance
Performance compares actual running speed with the expected cycle rate. A machine may show a running state while producing slowly because of cautious operation, small jams, worn tooling, or upstream starvation.
The next-shift lever is cycle loss. Review the periods where the machine was technically running but failed to meet its expected rate.
Quality
Quality separates accepted output from total output. A line that produces quickly but creates scrap or rework has converted machine time into avoidable cost.
Use defect codes and timestamps. If rejects cluster after a setup, a temperature change, or a tooling replacement, quality and maintenance can investigate the process condition rather than argue over the total scrap count.
OEE
OEE is the product of availability, performance, and quality. For example, if a line operates at 80% availability, 90% performance, and 98% quality, its OEE is 70.56%. The multiplication matters because losses compound. A line can look acceptable in each category separately while the combined result remains weak.
OEE is useful only when it points to a loss code, owner, and action. Without that connection, it's a management score with no operating value.
First-pass yield
First-pass yield measures the share of units that pass the process without rework. It complements quality because it focuses on getting the part right the first time, not merely counting final accepted output after repair.
For a practical manufacturing data analytics approach, configure the system so supervisors can trace first-pass failures to product, station, shift, material, or process condition.
| KPI | What It Measures | Typical Target | Action It Triggers |
|---|---|---|---|
| Availability | Planned time the equipment is running | Plant-defined baseline | Remove recurring stops and reduce changeover loss |
| Performance | Actual speed compared with expected cycle rate | Standard cycle expectation | Investigate slow cycles, micro-stops, and starvation |
| Quality | Accepted output compared with total output | Process-specific acceptance requirement | Address defects, scrap, and quality holds |
| OEE | Combined availability, performance, and quality | Improvement baseline by line | Prioritize the largest combined loss |
| First-pass yield | Units accepted without rework | Product and process requirement | Correct causes of first-time failure |
Targets must come from the process, product, and customer requirement. Don't copy a generic benchmark and call it a production strategy.
How Data Flows from Machine to Decision
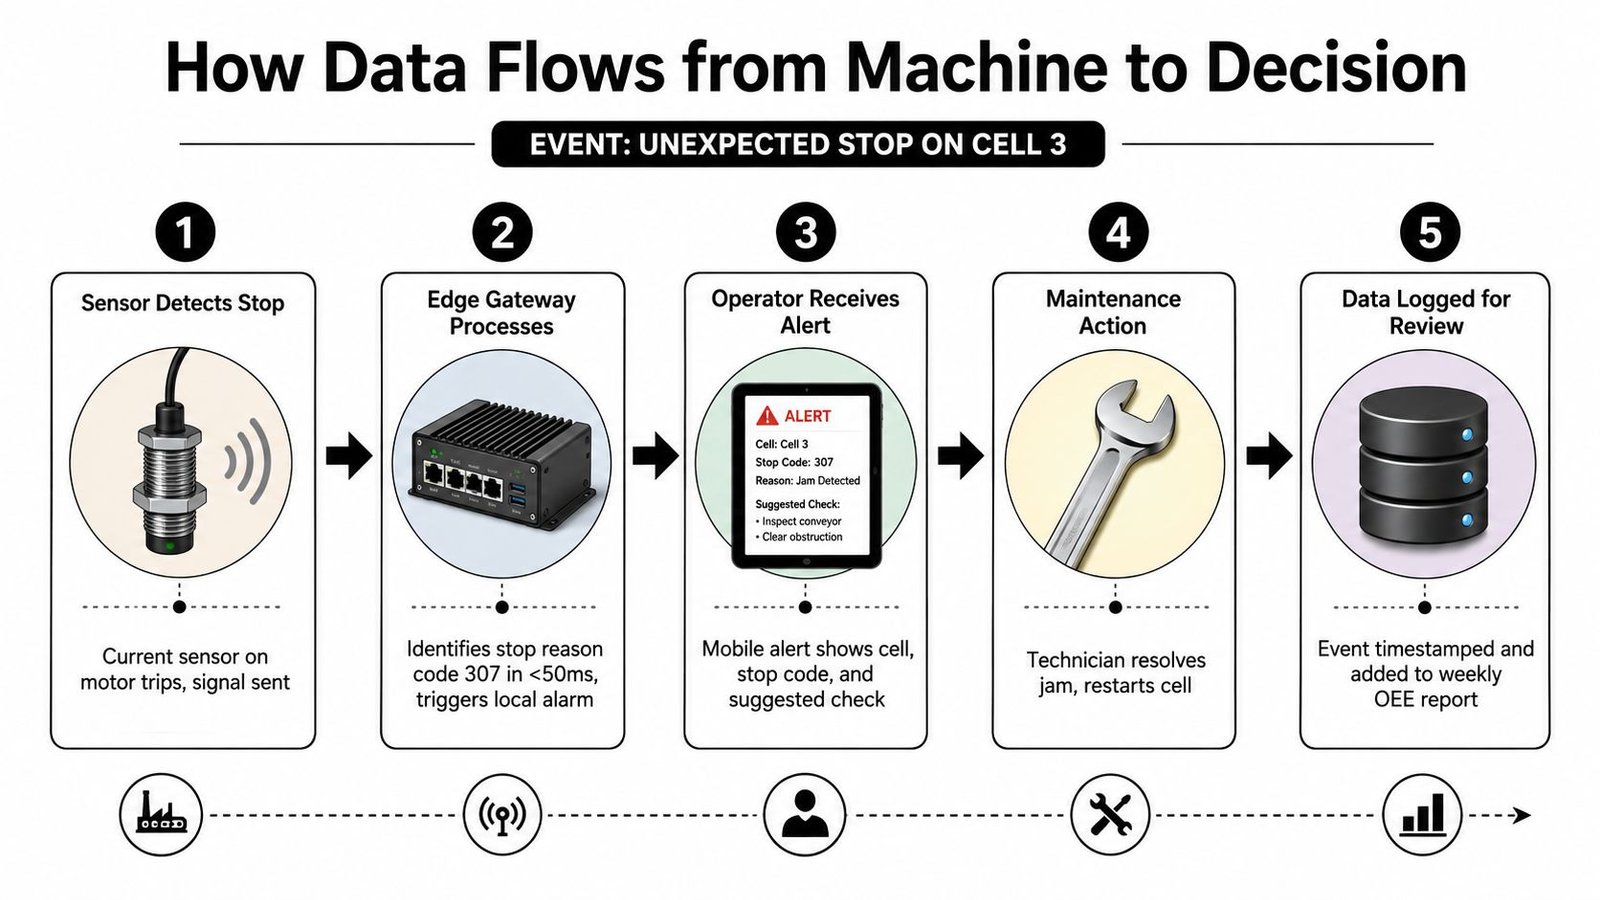
A useful monitoring architecture follows one event all the way through the plant. Consider an unexpected stop on Cell 3.
The current sensor or machine-state signal detects that the motor has stopped. The PLC records the state change, while an edge gateway timestamps the event, checks whether it matches a planned condition, and assigns the relevant downtime context. If the event is treated as an unclassified stop, the system should prompt the operator for a reason instead of filing it under “other.”
Split fast decisions from slow analysis
Edge processing is the correct choice for latency-sensitive decisions. Industrial edge systems commonly operate in the 5 to 20 ms range, while cloud-based paths are often 50 to 200 ms and can exceed 300 ms in constrained environments, according to manufacturing latency and IIoT reporting.
That difference affects reject signals, inline inspection, interlocks, and immediate alarms. Send summaries, historical trends, reports, and cross-site analysis to the cloud or central server. Keep decisions that must happen within the machine's operating window local.
An industrial network behaves like plumbing. Sensors provide the flow, gateways regulate and filter it, and servers store the useful volume. Buffering prevents a temporary network problem from deleting events. Timestamping preserves sequence. Event classification turns a raw stop into a maintenance, material, setup, or quality action.
Follow the Cell 3 event
The operator receives the alert, checks the cell, and records the reason code. A technician clears the jam and restarts the equipment. The event then enters the OEE history, where a supervisor can review its duration, frequency, and recurrence by machine, line, and shift.
The weekly review shouldn't ask only how much time was lost. It should ask whether the same fault is recurring, whether the reason code is trusted, and whether a mechanical, process, or material action will prevent repetition.
See how telemetry and process controls support this split between immediate control and higher-level analysis.
The architecture decision comes before the software decision. A polished dashboard can't repair a design that sends time-critical machine events through a slow or unreliable path.
Rolling Out Without Burning the Budget
A plant-wide installation is usually the wrong first move for a small or mid-sized manufacturer. Start with one bottleneck line, prove that the data is accurate, connect the information to a real decision, and expand only after the operating team trusts the result.
The category is no longer an experimental niche. One industrial machine monitoring market estimate placed the global market at about USD 4.64 billion in 2024. The same source cites a forecast from USD 5.06 billion in 2025 to USD 12.0 billion by 2035 at a 9.1% CAGR, while a separate machine condition monitoring forecast places that market at USD 3.1 billion in 2024 and USD 4.7 billion by 2029 at an 8.3% CAGR. Treat those as market context, not proof that a particular plant will receive a return.
Phase one targets one constraint
Choose the line where lost time, scrap, changeover delay, or energy intensity creates a visible business problem. Define the baseline with the data already available, then instrument only what is needed to explain the loss.
A defensible internal case might connect:
- Recovered shift time to additional sellable output.
- Lower scrap to material and rework cost avoided.
- Shorter changeovers to usable production capacity.
- Energy per unit to production cost and sustainability reporting.
Don't promise savings before the system can distinguish actual losses from bad records. The first return is often confidence in the numbers, followed by targeted action.
Phase two validates the truth
Run the pilot alongside existing records. Compare machine counts with physical counts, test downtime states against what operators observe, and review reason codes with the people who enter them.
If the system reports a stop that operators call a planned setup, fix the classification. If the counter misses parts, correct the signal or scaling. A smaller, accurate deployment beats a larger installation that creates arguments in every production meeting.
Phase three scales the pattern
Once the first line produces trusted data, reuse the proven tag structure, reason-code rules, alert design, and training approach. Expand to the next constraint, not automatically to every asset.
The visibility gap justifies this discipline. A production monitoring market overview cites that only 16% of producers had real-time shop-floor visibility in 2024, and identifies disconnected systems as a common cause of weak production-performance and quality-control data. For budget-constrained plants, that gap is an opportunity to establish useful visibility without funding a full factory overhaul.
CFO-ready argument: Fund the next phase when the current phase produces trusted data, a named operational action, and a measurable business outcome.
GMP, Medical Devices, and Audit-Ready Data
For medical device manufacturers and other regulated operations, monitoring data must support daily production and preserve a reliable account of what happened. The system should function as a flight data recorder, allowing the plant to reconstruct a batch sequence from system records instead of binders, memory, and handwritten notes.
Build traceability into the event model
Retain machine states, process parameters, operator actions, alarms, downtime reasons, quality checks, and batch or work-order context. Every record needs suitable timestamps, user attribution, access controls, and change history.
This structure supports 21 CFR Part 11-style expectations for electronic records, traceability, attribution, and data integrity. A monitoring platform does not replace a validated quality system. It does reduce the manual work needed to assemble production evidence, provided the event model is defined before deployment.
For a batch process or medical device assembly cell, the system should answer:
- Which work order was active?
- Which equipment and recipe were used?
- Which parameters moved outside the approved range?
- Who acknowledged an alarm or entered a reason code?
- Which units passed, failed, or required rework?
- What maintenance or setup event occurred during the run?
If legacy equipment or manual stations cannot provide every signal, record the operator input and its source clearly. A partial record with defined ownership is more useful than a polished dashboard built on unexplained gaps.
Use review by exception
MES-integrated monitoring supports a review-by-exception workflow. Quality personnel can focus on alarms, out-of-range parameters, missing records, and failed checks instead of rereading every normal event.
Define exceptions before configuring alerts. Constant notifications train users to ignore the system. Set alarms around product risk, process limits, and required actions, then document the operator response and escalation path.
Electronic batch records should draw from the same trusted production events used for operational monitoring. Operators then avoid creating one record for production and another for quality. Engineering, operations, and quality work from the same event history, while auditors can follow the sequence without reconciling separate files.
Audit-ready means reconstructable: The record should show what happened, when it happened, who acted, and why the batch was accepted or held.
Why Monitoring Projects Quietly Fail
Buying more sensors won't create better decisions. Monitoring projects stall when plants increase data volume without fixing trust, ownership, and workflow.
Five failure patterns
- Instrumenting everything first: The team connects every machine before proving one line's counts and states. Nobody knows which tags matter, and the project becomes an integration exercise instead of a production improvement.
- Excluding operators: Engineers define reason codes from a conference room. Operators then choose “miscellaneous” because the available choices don't match what they see.
- Treating the dashboard as the deliverable: The system displays downtime but doesn't assign an owner, trigger a check, or support a review. People admire the screen and continue managing by instinct.
- Ignoring legacy connectivity: Modern equipment reports clean data while older presses, fixtures, and manual stations remain invisible. The plant gets a polished blind spot.
- Underfunding change management: Supervisors aren't trained to use the data, maintenance doesn't trust the alarms, and managers keep requesting reports outside the system. Adoption fades even when the technology works.
The deeper issue is that more monitoring alone is no longer enough. Buyers increasingly need energy and sustainability measures alongside productivity metrics, with data connected to cross-functional decisions. Current production monitoring guidance also describes movement toward action-oriented systems, AI-supported root-cause analysis, and ERP or MES integration.
The practical test is simple. When an alert appears, can someone act on it? If not, the plant has collected information, not improved control.
A Practical Selection and Implementation Checklist
Bring a scorecard to vendor meetings, not a feature wishlist.
Selection criteria
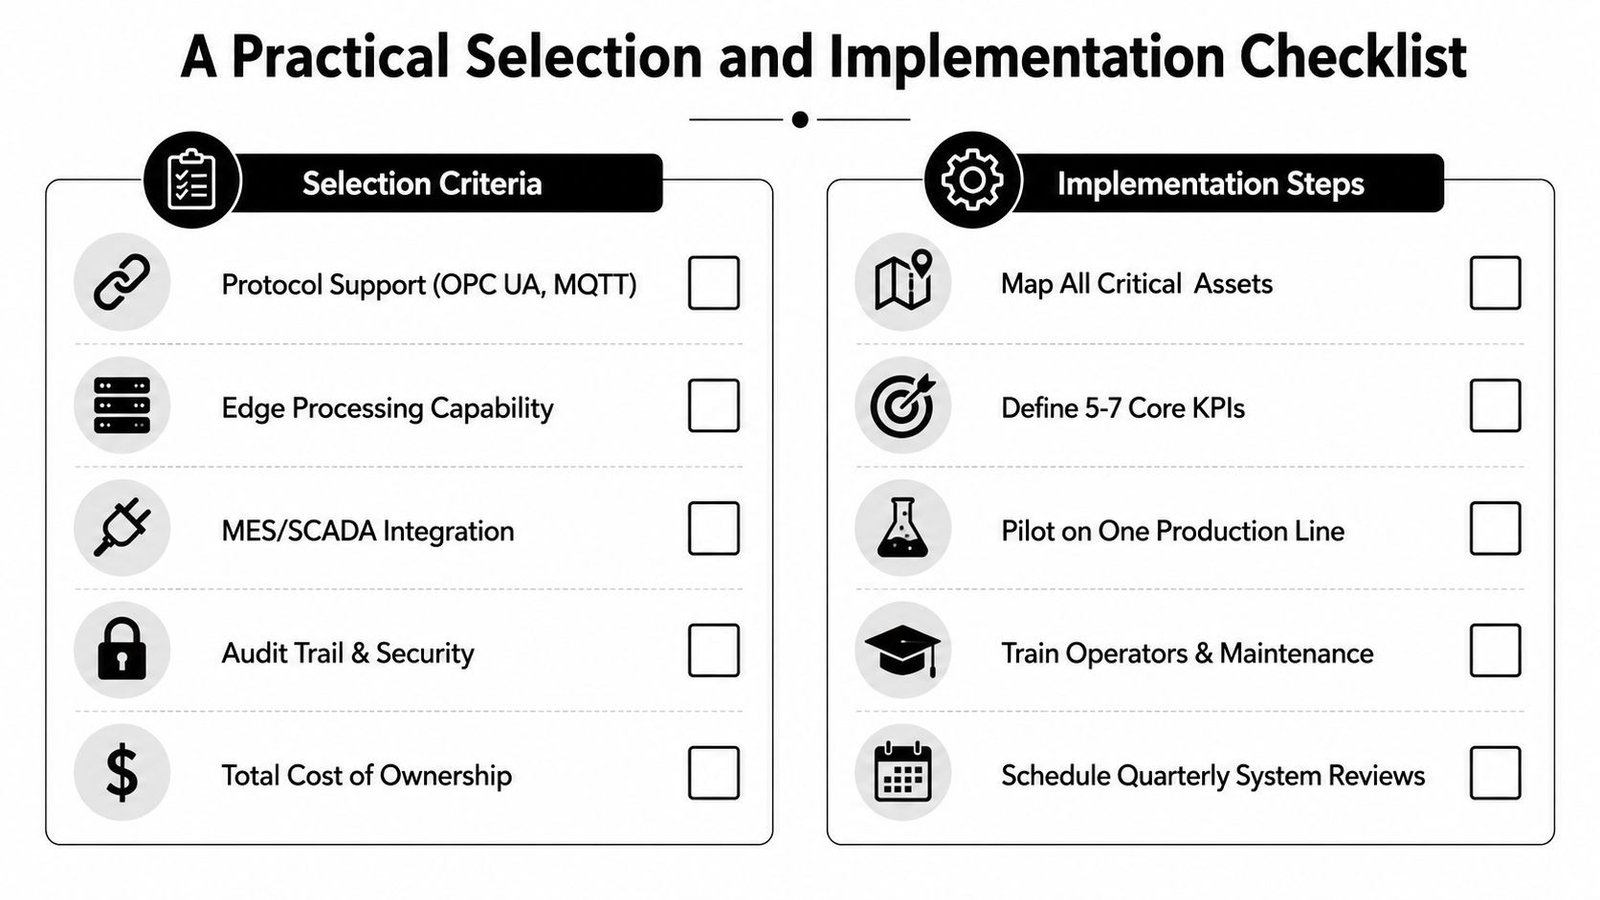
- Protocol support: Confirm OPC UA, MQTT, PLC, and legacy signal compatibility.
- Edge capability: Verify local buffering, filtering, timestamping, and time-sensitive alarm handling.
- MES and SCADA integration: Check how work orders, batches, states, and quality results connect.
- Audit trails and security: Review user attribution, change history, permissions, and record retention.
- Total cost of ownership: Include hardware, licenses, integration, training, support, and future expansion.
Implementation criteria
- Map critical assets and define the five core KPIs that operators and managers will use.
- Pilot one line, validate counts and reason codes, tune alerts, and train the shift team.
- Set a 90-day review gate. Expand only when the data is trusted and the workflow produces a documented operational response.
Retrofit monitoring when the existing machine still delivers useful mechanical and control performance, but lacks visibility. Replace equipment when safety, reliability, control architecture, or product capability makes retrofitting more expensive and less dependable than a new build.
System Engineering & Automation helps manufacturers connect production monitoring with practical automation, semi-automatic systems, tooling, fixtures, and integrated controls. Visit System Engineering & Automation to discuss a phased solution that fits your equipment, GMP requirements, production goals, and budget.