

An operator has spent three hours reaching over a conveyor to seat the same housing into a fixture. The part is light, but the repeated reach is not. By the end of the shift, cycle time has drifted, quality checks take longer, and the supervisor is debating whether the answer is a new robot cell.
Often, it isn't. Workstation optimization starts with the cell you already have. A better fixture angle, a controlled part presentation, a powered roller, or a torque tool with process feedback can remove the constraint without forcing a full automation project. The right design improves the operator's working conditions while addressing throughput, quality, waste, and future product changeovers.
Table of Contents
- Why Manufacturers Are Rethinking the Workstation
- Assess the Cell the Way an Engineer Would
- Designing the Optimized Workstation
- Choosing the Right Level of Automation
- Controls, Validation, and Commissioning
- Measuring ROI and Proving It Worked
- Maintenance, Iteration, and the First Step to Take This Week
Why Manufacturers Are Rethinking the Workstation
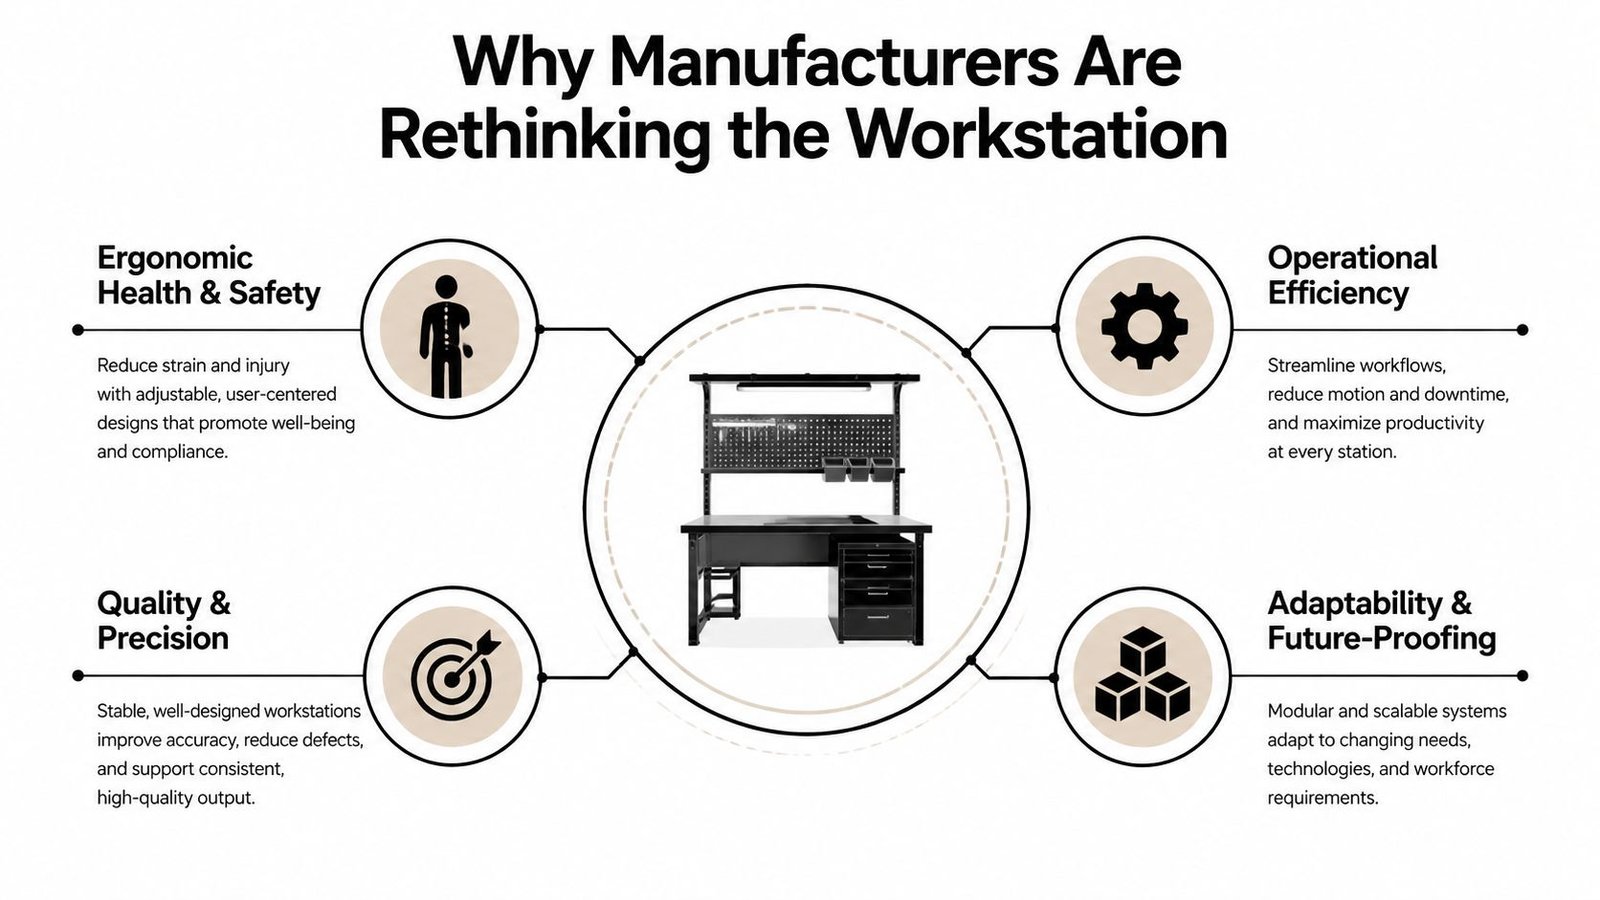
A workstation isn't just a place where work happens. It determines how far an operator reaches, how often parts are handled, whether defects are caught at the source, and how easily the cell can absorb the next product variant.
That makes workstation optimization a multi-objective engineering problem. The redesign should move four KPI families together:
- Throughput: Cycle time, processing time, and output at the required takt.
- Quality: First-pass yield, defect containment, rework, and error-proofing.
- Safety: Posture, force, lifting exposure, repetition, and operator fatigue.
- Waste: Scrap, excess motion, waiting, energy use, material handling, and unnecessary inventory.
Mid-sized manufacturers feel these trade-offs sharply. Skilled labor is harder to replace, a single recordable injury can disrupt staffing and production, and the next customer contract may compress takt time without increasing available floor space. An aging workforce also makes it harder to accept a fixture that requires every operator to reach into the same deep pocket for every cycle.
Why simple changes often win
A six-figure robot cell may be technically impressive, but it can be the wrong financial and operational answer when volume is moderate, the product mix changes frequently, or validation requirements are demanding. A re-angled fixture and a powered roller can address the actual constraint with less disruption and more flexibility.
Recent manufacturing evidence supports that broader view. A 2026 manufacturing ergonomics study reported that data-driven workstation optimization can reduce musculoskeletal-disorder risk by approximately 32%, increase labor productivity by 12–18%, and reduce energy intensity and material waste by 8–14% (manufacturing ergonomics study). The point isn't that every cell will produce those exact results. The point is that safety, output, and sustainability can improve through the same engineering intervention.
A practical project doesn't need to wait for a corporate capital cycle. Start with one bottleneck, establish a baseline, redesign the physical and control elements, and verify the result against the same measures. Manufacturers seeking a broader view of production cost can also use this production cost reduction guide to connect workstation changes with labor, material, and operating expenses.
Assess the Cell the Way an Engineer Would
Don't start by buying a lift table or asking a robot integrator for a concept. Start by observing the cell and recording what happens.
Establish the baseline
Measure cycle time across at least thirty cycles, including normal variation rather than only clean demonstration runs. Record the takt requirement, standard work sequence, operator count, downtime, first-pass yield, rework, and scrap. Separate value-added work from non-value-added motion, then identify the top three time thieves. They may be walking, waiting for material, reaching, searching for tools, correcting orientation, or repeating an inspection.
Use a video only under the site's privacy and labor policies, and review it with representative operators. The operator often knows why the standard work fails, particularly when the written sequence ignores replenishment, fixture loading, inspection access, or minor stoppages.
Ergonomic assessment should use recognized methods rather than visual impressions alone. Apply the NIOSH lifting equations where lifting exposure exists, and use REBA or RULA for posture. Record force or weight at the actual grip point, not only the nominal part weight. A housing that weighs little may still create high shoulder or wrist exposure when the grip is distant, rotated, or repeated.
Capture the conditions around the task
Lighting, glare, ambient noise, heat from adjacent equipment, and poor access to visual inspection can all affect performance. A defect that operators can't see clearly becomes a quality problem, while noise that masks an alarm becomes a reliability problem.
The baseline scorecard should be simple enough for operations to maintain and specific enough for engineering to use. A structured process mapping approach helps expose handoffs and hidden delays before drawings are released.
| Metric | Tool or Standard | Baseline Value |
|---|---|---|
| Cycle time and processing time | Stopwatch study, MTM-1, standard work observation | Record actual cell result |
| Takt alignment | Customer demand and production schedule | Record required takt |
| Posture exposure | RULA or REBA | Record observed score |
| Lifting exposure | NIOSH lifting equations | Record calculated result |
| Force and load | Grip-point force or weight audit | Record measured exposure |
| First-pass yield | Quality records by workstation | Record station result |
| Rework and scrap | Defect log and material records | Record station result |
| Value-added time | Standard work and motion analysis | Record observed share |
| Environmental conditions | Lighting, glare, noise, and heat checks | Record observed condition |
Fraunhofer IPA's summary of 250 ergonomics case studies found productivity improvement in 61 studies, with an average gain of 25%, a median gain of 20%, and a reported 95% confidence interval of 20–30% (Fraunhofer IPA ergonomics case-study summary). The same summary reported that workdays lost fell by an average of 75% across 78 studies, while sickness cases fell by 65% across 53 studies. Those historical results make the baseline discipline worthwhile, but they aren't a promise for an individual cell. Your own before-and-after data remains the decision standard.
Designing the Optimized Workstation
A good design converts observed losses into physical, procedural, and control changes. It makes the bench more comfortable.
Design around the operator population
Use anthropometric data to design for the 5th-to-95th percentile reach envelope, rather than designing around an average operator. Set the fixture height, presentation angle, monitor position, and tool location so shorter operators aren't forced to stretch and taller operators aren't forced to bend.
Standardized work should define the sequence, takt, work-in-process allowance, inspection points, and replenishment method. Challenge every motion with a direct question: does this action change the product, verify quality, or protect the process? If not, move, remove, combine, or automate it.
Fixtures and jigs should present parts inside the operator's neutral zone. Gravity chutes, spring returns, compliant nests, and guided locators can eliminate awkward return strokes without adding complex controls. A poka-yoke locator should make an incorrect part difficult or impossible to seat, rather than relying on memory or a final inspection to catch orientation errors.
Select tools that provide evidence
Smart tooling earns its place when it improves both the task and the record. Torque controllers with process feedback can confirm that the fastening step occurred within the approved window. A quick-change interface can make a fixture adaptable to product variation, but only if the changeover procedure is controlled and the locating repeatability is verified.
A workstation-layout study using ergonomics and simulation reported 26% floor-space savings and about 30% improvement in productivity, quality, and WIP reduction in one electronics assembly study. Another layout study reported a 78% efficiency increase and a 194% productivity increase compared with the existing layout (anthropometric workstation and layout literature). These results come from specific study conditions, so treat them as evidence of design potential, not as a forecast.
For fixture concepts, consider fixture design and manufacturing services when internal resources can't turn the observed requirement into a repeatable, maintainable design.
Before releasing drawings, check:
- Reach: Can the intended operator population access every part and control without excessive extension?
- Sequence: Does the physical layout support the approved standardized work?
- Quality: Does the fixture prevent incorrect loading and provide access for inspection?
- Takt: Are conveyor, indexing, and tool actions sized to the required cycle?
- Changeover: Can the cell change product without unnecessary disassembly or lengthy recalibration?
- Maintenance: Can technicians access wear components, sensors, pneumatics, and wiring?
- Validation: Can the design produce objective evidence for quality and regulated-process requirements?
The strongest designs tune reach distance, posture, takt alignment, and material flow together. Changing one dimension in isolation often shifts the problem elsewhere in the cell.
Choosing the Right Level of Automation
Automation should match the production problem, not the sales presentation. Compare manual, semi-automatic, and fully automatic options against volume, mix, takt, part weight, footprint, changeover, validation, and available maintenance capability.
| Criterion | Manual | Semi-Automatic | Fully Automatic |
|---|---|---|---|
| Volume | Best for variable or lower volume | Suited to repeatable mid-volume work | Suited to stable, high-volume production |
| Product mix | Highly flexible | Flexible with quick-change tooling | Less flexible unless designed for variants |
| Ergonomic exposure | Depends heavily on fixture and standard work | Can remove the highest-risk motions | Can remove most direct handling exposure |
| Takt control | Operator-dependent | Controlled by indexing, tooling, or assisted motion | Controlled by integrated sequencing |
| Footprint | Usually smallest | Moderate, depending on buffers and guarding | Often larger because of handling, guarding, and utilities |
| Changeover | Simple if fixtures are universal | Fast when interfaces are standardized | Can be lengthy if recipes and tooling are complex |
| Validation burden | Lower, though process controls still matter | Moderate | Higher because more functions must be verified |
| Maintenance demand | Lower equipment burden | Requires controls, sensors, and mechanical upkeep | Requires broader automation and troubleshooting skills |
Semi-automation often captures the useful part of a robot cell without paying for every function. Conveyors, indexing tables, guided fixtures, torque-presenting tools, and light-cobot assistance can remove walking, awkward holding, and repetitive fastening while leaving the operator responsible for variable judgment. The practical target isn't a fixed percentage of robot-cell performance. It's the smallest investment that removes the measured constraint.
A practical fastening example
Consider a mid-volume screw-fastening station. The manual operator loads the part, positions a handheld torque wrench, fastens the screw, confirms completion, and unloads the assembly. A servo-driven fixture can hold orientation and present the joint, while a light-cobot or powered torque tool performs the repeatable fastening and returns a result to the controls.
The decision should be based on measured volume, takt, changeover frequency, part variation, and ergonomic exposure. A volume threshold alone isn't enough, and the specific figure should come from the manufacturer's business case rather than a generic rule.
Over-automation creates its own losses when changeover becomes so cumbersome that the cell spends production time waiting for tooling, recipes, or validation. Under-automation fails when the added device improves output but leaves the high-risk reach, lift, or grip untouched.
Practical rule: Automate the repeatable constraint first. Keep human judgment where variation is high, and use fixtures or support technology before replacing an entire task.
Controls, Validation, and Commissioning
A workstation that moves parts efficiently but faults unpredictably is not optimized. Controls must make the intended sequence clear to operators and maintainers, while safety and quality functions must remain testable.
Build the control architecture around risk
Use a safety relay for a suitably simple architecture when the risk assessment and required functions support it. Use a safety PLC when the cell needs multiple zones, monitored gates, muting logic, diagnostic coverage, or coordinated safety functions. The choice shouldn't be made by habit or by the number of devices on the bill of materials.
Place the HMI where the operator can read status and respond without twisting away from the task. Separate safety devices from ordinary process sensors in the design documentation, and label wiring so a technician can trace a fault without reconstructing the panel from memory. Light curtains, interlocks, emergency stops, and reset logic should be verified as functions, not merely checked as installed components.
Integration matters in semi-automated cells. Define how the station receives a part-ready signal, confirms upstream availability, manages a downstream block, handles a rejected part, and recovers after a fault. Buffer logic should prevent one brief stop from creating unnecessary upstream or downstream disruption. If the plant uses MES, OPC-UA, or another production interface, define the handshake and ownership of each status before commissioning.
Treat regulated production as an evidence problem
Medical-device, pharmaceutical, food, and aerospace operations may need controlled design records, traceability, approved recipes, and documented change control. In GMP-aware environments, contamination control must be built into design and operation. The SFDA GMP guideline states that cross-contamination must be prevented through appropriate design and operation, access to manufacturing areas should pass through a gowning area restricted to authorized personnel, and workstation and environmental monitoring should cover radioactive, particulate, and microbiological quality as established during performance qualification.
Where applicable, plan for GMP and GAMP 5 expectations, IQ, OQ, and PQ documentation, and data-integrity controls such as 21 CFR Part 11 or EU Annex 11. The exact package depends on the product, process, jurisdiction, and quality system. Don't bolt validation onto a finished machine after the design has made evidence difficult to collect.
Commission with a signed checklist
At site acceptance, operators and technicians should verify:
- Power and grounding: Confirm voltage, protective grounding, panel labeling, and utility connections.
- Safety response: Test E-stops, light curtains, interlocks, resets, and safe states.
- Sensors and tools: Calibrate sensors, verify torque feedback, and confirm tool communication.
- Recipes: Load approved recipes, confirm access permissions, and test changeover selection.
- Fault recovery: Simulate part-present, reject, jam, communication, and sensor faults.
- First article: Run a structured first-article sequence and retain the required quality evidence.
Measuring ROI and Proving It Worked
The project survives a budget review when operations can show what changed, by how much, and under which production conditions. Measure the redesigned workstation against the original setup using the same part family, staffing assumptions, quality criteria, and demand profile.
Separate hard and soft returns
Hard ROI includes labor consumption, scrap, rework, throughput, energy, consumables, and avoided overtime. Soft benefits include operator confidence, safety performance, audit findings, training consistency, changeover experience, and reduced dependence on one highly experienced employee.
A useful dashboard should show the operational connection between the intervention and the result:
- Cycle time: Measure processing time and non-value-added time separately. Processing time is the time required to complete a process step at the workstation, while value-adding time identifies the portion that changes the product or advances its required state (workstation performance indicators).
- Quality: Track first-pass yield, defects by mode, rework hours, and material disposition.
- Ergonomics: Repeat the same RULA, REBA, lifting, and force assessments used at baseline.
- Waste: Record scrap, material handling, energy intensity where available, and consumable use.
- Reliability: Track downtime, minor stops, fault categories, and mean time to recover.
Use transparent formulas
For cycle-time compression:
Cycle-time compression = (baseline cycle time minus new cycle time) divided by baseline cycle time
For an OEE comparison:
OEE = availability multiplied by performance multiplied by quality
Use the same definitions before and after the change. If the cell's availability improves because a separate upstream problem was fixed, don't attribute the entire lift to workstation optimization.
For payback:
Payback period = total project cost divided by verified periodic benefit
Total project cost should include tooling, fixtures, controls, installation, training, validation, and production downtime during implementation. Periodic benefit should use verified savings and contribution from additional good output, not an optimistic sales forecast.
Review the dashboard at 30, 60, and 90 days, then keep the measures in the operating review. The operations team should own the numbers, while engineering supports interpretation and further changes.
The historical evidence is useful context, but the local baseline is what protects credibility. A gain that disappears after a product mix change or operator reassignment wasn't fully engineered into the system.
Maintenance, Iteration, and the First Step to Take This Week
Workstation optimization is a living production system. Fixtures wear, sensors drift, operators discover shortcuts, material presentation changes, and new SKUs arrive. Without ownership, the cell gradually returns to its old cycle time and old ergonomic exposures.
Assign a maintenance and improvement cadence that fits normal plant routines:
- Daily: Complete a five-minute operator check for fixture condition, sensor status, tool condition, abnormal noise, and material presentation.
- Weekly: Review torque results, lubrication points, fastener security, and recurring minor stops.
- Monthly: Conduct a TPM review of fixtures, pneumatic circuits, guarding, cables, and wear components.
- Quarterly: Recheck ergonomics and takt alignment, then rank losses in a Pareto of downtime, quality, motion, and material issues.
- Continuously: Maintain a one-page iteration log for PDCA cycles, Kaizen suggestions, scrap trends, spills, training changes, and approved countermeasures.
The log matters because it connects small changes to operating results. It also prevents teams from making the same adjustment repeatedly without recording what happened.
Start with one bottleneck
This week, select one workstation that regularly misses takt, generates rework, or exposes operators to unnecessary reach or force. Run a 30-minute observation using the RULA and value-stream-mapping methods already described, then write a one-page charter before scheduling a vendor visit.
The charter should state the problem, baseline measures, affected part family, operator and quality concerns, constraints, desired outcomes, and owner. It should also identify what won't change, such as a validated process parameter or a fixed downstream interface. That discipline keeps the conversation focused on the actual production problem.
A caution is necessary around impressive micro-cases. The supplied evidence includes studies reporting meaningful ergonomic and productivity gains, but it doesn't verify the proposed Midwest medical-device pack-out example or the claimed 38% changeover reduction through fixture standardization. That example shouldn't be presented as a factual case study. The broader lesson remains valid: a small, owned fixture improvement can be more useful than waiting for a robot project that doesn't fit the product mix, budget, or validation window.
System Engineering & Automation offers manual, semi-automatic, and fully automated equipment, along with custom tooling, fixtures, integrated controls, installation, commissioning, and ongoing maintenance support. Visit System Engineering & Automation to discuss a workstation assessment that connects ergonomics, throughput, quality, flexibility, and budget to a practical manufacturing solution.