
The most popular advice about predictive maintenance manufacturing is also the least reliable: install sensors, connect a cloud platform, add artificial intelligence, and expect failures to announce themselves before they happen. That approach sells technology before it identifies a problem. On a semi-automated line or a GMP-aware medical device cell, it can create more alarms, validation work, and integration cost without improving a single maintenance decision.
A better approach starts with the failure mode. Predictive maintenance earns its place when a machine degrades in a measurable way, the failure matters to production or quality, and your team has enough time and authority to intervene. It isn't worth funding because a vendor can display a health score. The practical question is narrower: which failure should we detect, what signal will reveal it, and what will we do when the alert arrives?
Table of Contents
- Why Most Predictive Maintenance Pitches Miss the Point
- What Predictive Maintenance Actually Means on a Factory Floor
- The Technology Stack Behind a Working PdM System
- A Practical Roadmap to Roll Out Predictive Maintenance
- Where PdM Wins and Where It Quietly Fails
- Two Plant Stories That Show PdM in Real Operations
- KPIs, Common Failure Modes, and How to Avoid Them
- Your Next 12 Months With Predictive Maintenance
Why Most Predictive Maintenance Pitches Miss the Point
A vendor demonstration usually begins with a polished dashboard. Assets turn green, yellow, or red. A model identifies an anomaly. A maintenance work order appears with a reassuring level of automation. None of that proves the system can detect a failure mode on your equipment, under your operating conditions, early enough for your team to act.
The market is substantial, which helps explain the pressure to buy. One estimate values the global predictive maintenance market at US$14.2 billion in 2025 and projects it to reach US$98.1 billion by 2033, with a 27.9% compound annual growth rate, according to Grand View Research's predictive maintenance market analysis. A separate estimate places the manufacturing predictive maintenance segment at US$17.46 billion in 2026, rising to US$180.24 billion by 2035, from the same market reference. Those projections describe investment momentum, not a guaranteed return for your plant.
Start with the asset, not the platform
For a small or mid-sized manufacturer, PdM generally makes economic sense when three conditions align:
- The consequence is material: A failed pump, compressor, spindle, or process chiller can stop a line, disrupt a controlled environment, or create quality exposure.
- The degradation is observable: Vibration, temperature, motor current, acoustic emission, pressure, flow, or oil debris changes before the failure.
- The repair window is usable: Maintenance can obtain the part, schedule the work, and safely intervene before production suffers.
The strategy becomes weak when the root cause is random, the failure occurs without a useful runway, or the asset is cheap and easy to replace. A fuse doesn't need an AI model. A belt that should be replaced during a well-managed preventive route may not justify a sensor, gateway, and validated alert workflow.
Practical rule: Require a failure-mode business case for every monitored asset. A fleet-wide subscription isn't a business case.
The operational upside is real. A NIST report on advanced maintenance in manufacturing states that predictive maintenance can increase equipment efficiency by 15% to 25%. Industry reporting associates PdM with maintenance-cost reductions of 20% to 30% and unplanned-downtime reductions of 30% to 50% compared with reactive approaches, using the same NIST reference provided for this operational context. Those outcomes depend on selecting suitable failure modes and acting on alerts. They don't come automatically from collecting more data.
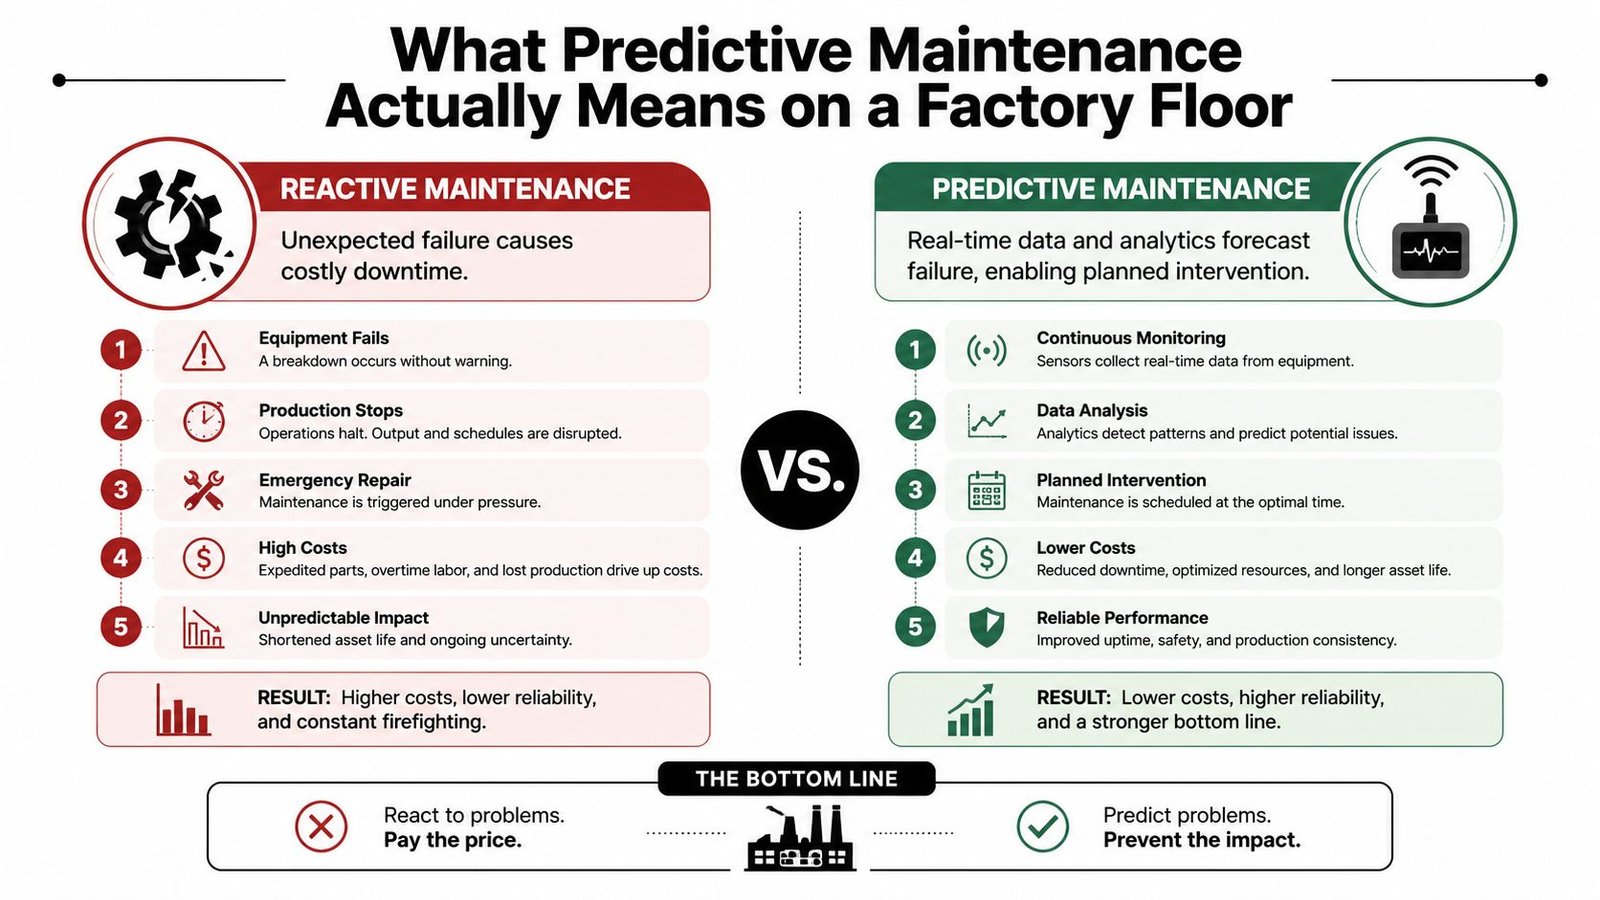
What Predictive Maintenance Actually Means on a Factory Floor
Predictive maintenance is a condition-based decision strategy. Sensors observe the physical state of equipment, analytics identify a meaningful change, and the maintenance team plans an intervention before the developing fault becomes a production event. The software matters, but the decision is the product.
The difference becomes clear beside other maintenance approaches:
- Reactive maintenance waits for the breakdown. It can suit noncritical, inexpensive assets with simple replacement procedures, but it gives operations the least control over timing.
- Preventive maintenance replaces or services components on a calendar, operating hour, cycle count, or route. It creates discipline, though it can remove parts that still have useful life.
- Predictive maintenance uses the machine's actual condition to decide when inspection or repair is justified. It sits between run-to-failure and time-based intervention, but it requires reliable signals and a response process.
The car check-engine light is a useful analogy. Sensors can identify an oxygen-sensor problem, misfire, or catalyst-efficiency issue, but the warning only helps if the driver schedules a repair. A factory alert follows the same logic. A rising vibration signature on a centrifugal pump may indicate bearing deterioration, while a growing cycle-current trend on a heat-seal bar can reveal element wear. The alert creates a planning opportunity. It doesn't repair the machine.
The work order is the real output
A useful PdM system connects the signal to a defined action. That action might be an inspection, lubrication check, alignment verification, bearing replacement, filter change, or engineering review. Without that link, the plant gets a dashboard rather than a maintenance system.
Predictive maintenance also shouldn't be confused with a promise of exact failure timing. A trend can indicate that a bearing, gearbox, heater, or chiller is moving away from its normal operating state. The maintenance leader still needs to confirm the diagnosis, assess risk, and choose the intervention window.
The financial exposure can justify that discipline. One manufacturing estimate says unplanned downtime can cost facilities up to $150,000 per hour, and explains that PdM works by identifying early warning signs so repairs can be scheduled before disruption reaches production, as described in MaintainX's manufacturing predictive maintenance overview.
This short video provides a visual introduction to the operating concept:
The Technology Stack Behind a Working PdM System
A functioning PdM system has four practical layers. Each layer introduces a design choice, and none can compensate for a failure mode that produces no usable signal.
Sensing determines what you can know
Choose the sensor around the physics of the failure. An accelerometer is appropriate for many rotating-equipment faults, including bearing, imbalance, looseness, or misalignment signatures. Thermocouples suit thermal drift, motor overheating, heater-zone behavior, and process temperatures. Current transducers can reveal changes in motor load, servo behavior, or heater demand. Acoustic-emission sensors may detect high-frequency mechanical activity, while oil-wear particle counters can identify contamination and wear in lubricated systems.
A sensor kit designed to cover every asset usually covers no asset particularly well. Mounting location, orientation, sampling behavior, and operating-state context often matter more than the logo on the enclosure.
Gateways protect the plant network
The industrial gateway aggregates signals from existing controls and new sensors. Common interfaces include IO-Link, Modbus, OPC UA, and 4-20 mA loops. Local buffering matters in brownfield facilities because network interruptions shouldn't erase the evidence needed to interpret a trend.
For semi-automated cells, the gateway should read relevant PLC tags without taking ownership of critical control loops. Line speed, cycle state, motor load, reject signals, temperature, pressure, and fault codes can provide the operating context that prevents an analytics system from confusing a normal changeover with equipment degradation.
Analytics must match the response time
Edge analytics suits fast decisions, waveform capture, and local threshold alarms. Cloud analytics is useful for historical comparisons, fleet-level trends, and retraining models across accumulated data. A small plant may need both, but it shouldn't send every raw signal upstream if a local feature or event is enough for the maintenance decision.
A machine-monitoring platform can help organize these signals and link condition data to operational workflows, but the integration boundaries should remain explicit. Review machine monitoring software capabilities alongside your existing PLC, SCADA, CMMS, and network architecture.
Simple models often win
Model complexity doesn't equal reliability. Envelope analysis, RMS trending, spectral kurtosis, rule-based thresholds, and anomaly detection can solve many practical problems. Classifier-based models have a place when the plant has enough representative history and consistent labels.
On most small-plant projects, feature engineering and alarm tuning matter more than model architecture. A well-set RMS threshold on a vibration signal can outperform a poorly tuned long short-term memory model because the former produces an alert the team understands and trusts.
| Layer | Typical Components | Latency | Where It Earns Its Keep |
|---|---|---|---|
| Sensing | Accelerometers, thermocouples, current transducers, acoustic sensors, oil-particle counters | Depends on the signal and sampling approach | Captures physical evidence of a selected failure mode |
| Gateway | IO-Link, Modbus, OPC UA, 4-20 mA interfaces, local buffering | Local and near-real-time | Connects brownfield equipment while limiting network load |
| Analytics | Edge rules, RMS trends, spectral analysis, cloud history | Edge for fast events, cloud for batch analysis | Separates normal operating variation from degradation |
| Models | Thresholds, anomaly detection, classifiers, remaining-health logic | Depends on model and data flow | Prioritizes action when the signal supports a decision |
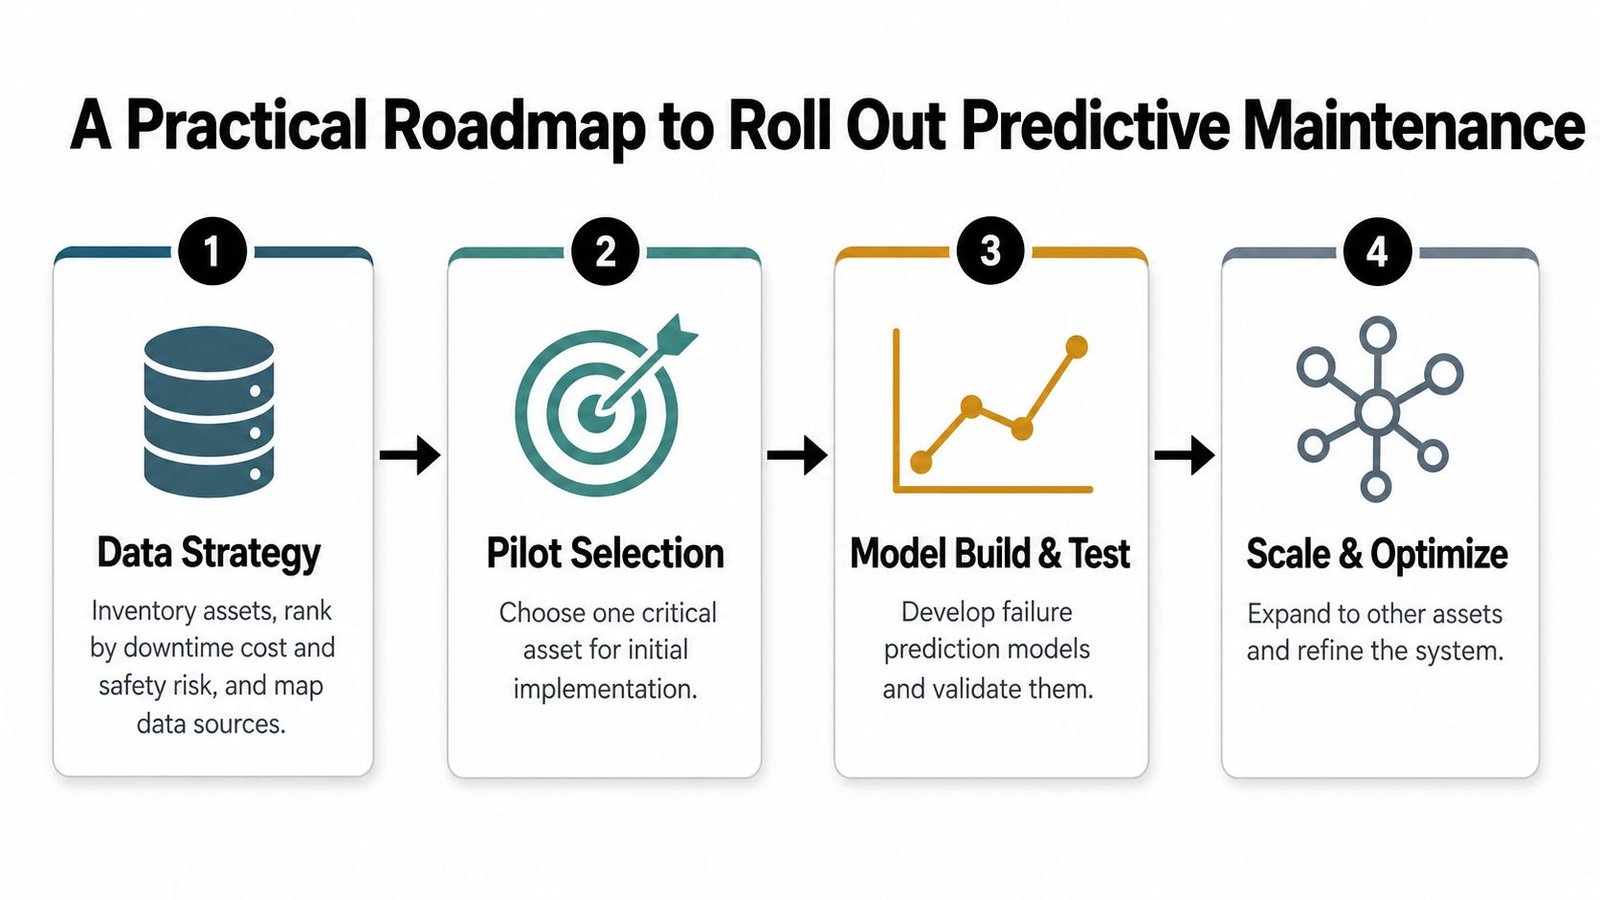
A Practical Roadmap to Roll Out Predictive Maintenance
A PdM rollout should answer one question at every stage: which failure are we trying to prevent? If the team can't answer that precisely, the project isn't ready for sensors or software.
Stage one starts with a data audit
Inventory the assets, then rank them by downtime consequence, safety exposure, quality impact, redundancy, and repair difficulty. Map the signals already available in PLCs, drives, HMIs, historians, and maintenance records. Only after that review should you identify missing measurements.
The decision gate is simple. Advance when at least one critical asset has a plausible failure mode and an obtainable signal. Hold when the asset's history is too poor to establish normal behavior. Kill the candidate when the expected intervention is cheaper and simpler than monitoring.
Stage two makes the pilot narrow
Select one asset and one failure mode. A pump bearing, compressor condition, spindle vibration, chiller temperature drift, or servo gearbox can make a sensible pilot if the plant can inspect the asset and schedule work after an alert.
Define the baseline before model development. Record operating states, normal ranges, maintenance history, production context, and existing failure indicators. Then set an alert threshold that a technician can verify, not a threshold chosen to make a demo look sensitive.
Track the alert outcome. Was the signal confirmed? Did the team inspect the asset? Was work scheduled? Did the failure occur, or did the alert identify a condition worth correcting without a breakdown? A pilot should advance only when the maintenance response is repeatable and the economic value is visible.
Stage three integrates with semi-automated cells
Use OPC UA to read suitable PLC tags where the controls architecture supports it. Keep safety functions and critical control loops on the existing controller. An edge gateway can aggregate selected values, buffer data locally, and forward features or events without turning the plant network into a raw-data pipeline.
Integration also includes the work process. An alert should reach the CMMS or maintenance queue with the asset identity, condition evidence, recommended inspection, and escalation rule. If technicians must copy values from one dashboard into another system, the project has an adoption problem.
Stage four handles GMP change control
In a GMP-aware medical device environment, a sensor and algorithm can affect more than maintenance. Document calibration, installation, software versions, access controls, data retention, alarm ownership, and the effect on IQ/OQ activities. Define whether the alert is informational, maintenance-critical, or connected to a validated process decision.
Threshold changes need controlled review. Model versions need traceability. The validated state shouldn't shift because a vendor retrained an algorithm in the cloud without notice.
Use digital twin and predictive maintenance planning when a virtual representation will clarify operating states, maintenance scenarios, or integration behavior. Don't add a digital twin because the project needs a more impressive name.
Where PdM Wins and Where It Quietly Fails
PdM is strongest when degradation is gradual, observable, and actionable. Rotating equipment often fits that pattern because vibration, temperature, current, pressure, or acoustic behavior can change before the machine stops.
It performs poorly when the failure is sudden, externally caused, or protected by a simpler maintenance task. This isn't a weakness in one particular algorithm. It is a limitation imposed by the failure physics and the available sampling.
| Failure Mode Category | Example Assets | PdM Fit | Why It Works or Doesn't | Recommended Action |
|---|---|---|---|---|
| Gradual rotating degradation | Pumps, motors, fans, compressors, spindles, gearboxes | Strong | Vibration, current, and temperature can trend toward failure | Instrument the selected fault and define inspection limits |
| Process drift | Heater zones, filters, coolant circuits | Good when signals exist | Temperature, pressure, flow, and current can reveal changing condition | Combine condition trends with process-state tags |
| Sudden mechanical failure | Bearing race fracture, impact damage, brittle fracture | Weak | There may be little or no usable degradation runway | Retain inspection, guarding, redundancy, and preventive controls |
| Electrical switching failure | Switches, relays, fuses | Poor | Failure can occur without a stable precursor | Use appropriate protection and replacement strategy |
| Low-consequence wear | Accessible belts, simple grease points | Often poor | A cheap route task may cost less than the monitoring system | Keep a disciplined preventive task |
| Sensor-invisible causes | Material defects, contamination spikes, events below sampling frequency | Weak | The selected signal may not observe the cause | Improve process controls or use a different detection method |
A 2026 industrial AI benchmark on PdM limitations reports reliable results for bearing wear, insulation ageing, impeller erosion, valve fatigue, and oil contamination, while reliability is substantially lower for material-defect fatigue fractures, impact events, contamination spikes, and failures below sensor sampling frequency. That distinction should shape the asset list before procurement begins.
The contrarian test: If you can't describe the precursor signal and the intervention window, don't call the asset a predictive-maintenance candidate.
Two Plant Stories That Show PdM in Real Operations
A mid-size packaging line running two shifts produced 40 million units a year. The team instrumented six critical motors with vibration and current sensors, read line speed and reject signals from the PLC over OPC UA, and ran a vibration anomaly model on an edge gateway. After ninety days, alert precision reached seventy-eight percent, and unplanned downtime on those assets fell from nine hours a month to under two, with the rollout paying back in seven months.
Those figures come from the operating scenario described here, not from a general industry benchmark. The important lesson is the design: the team monitored a defined group of motors, added production context, and ran the first analysis locally. The project had a measurable baseline and a maintenance response, rather than a fleet-wide health-score exercise.
The GMP case had a different definition of success
A GMP medical device assembly cell already had validated vision and torque processes. PdM was deliberately limited to chiller drift and servo gearbox wear, and threshold changes went through change control. The program's value wasn't framed as labor reduction or a broad cost claim.
A chiller trend identified condenser fouling two days before a release test would have detected the issue. The team could intervene before a batch-loss event. In a regulated environment, preventing quality exposure and preserving process control can matter more than maximizing the number of monitored assets.
The two scenarios show why predictive maintenance manufacturing programs need different business cases. The packaging line justified a direct uptime and payback calculation. The medical device cell justified narrowly controlled monitoring around equipment conditions that could affect a validated process.
KPIs, Common Failure Modes, and How to Avoid Them
A dashboard can look healthy while the maintenance program fails. Measure whether alerts lead to verified actions and whether those actions change plant outcomes.
Track unplanned downtime hours by asset and failure mode, rather than reporting a plant-wide number that hides the pilot's effect. Compare the MTBF delta against a defined baseline. Record the false alarm rate by alert class, and measure mean time to detect from the first meaningful signal change to the issued alert. Add maintenance cost per unit and the PdM contribution to OEE, but preserve the underlying work-order and production records so the figures can be audited.
The usual breakdowns are operational
Alarm fatigue starts when thresholds are too sensitive or every anomaly receives the same urgency. Integration gaps appear when OT tags, historian data, CMMS records, and quality systems use different asset names or timestamps. GMP validation drag appears when a vendor changes the model without giving quality and engineering a controlled version record.
Skill shortages also matter. A maintenance technician may understand a motor fault but not gateway diagnostics, time synchronization, or sensor mounting. Vendor lock-in creates another risk when proprietary analytics prevent the plant from exporting data, changing models, or retaining its own failure history.
| Failure Mode | Warning Sign | Mitigation |
|---|---|---|
| Alarm fatigue | Technicians acknowledge alerts without inspection | Tier alarms by consequence, require evidence, and retire low-value rules |
| OT and IT integration gaps | Alerts don't create usable work orders | Define ISA-95 boundaries, asset naming, timestamps, and ownership before deployment |
| GMP validation drag | Threshold or model changes arrive without controlled records | Establish version control, change-control review, and documented impact assessment |
| Edge hardware skill shortage | Data drops, unexplained gaps, or unstable gateways | Specify diagnostics, local buffering, support ownership, and training requirements |
| Proprietary platform dependence | The plant can't export raw data or history | Confirm data ownership, API access, model portability, and exit terms |
Use a structured failure mode analysis process before selecting technology. It forces operations, maintenance, engineering, and quality to agree on severity, detectability, causes, and response.
A stalled pilot usually needs less AI and more operating discipline. Fix the asset registry, alarm ownership, work-order workflow, and inspection standard before increasing model complexity.
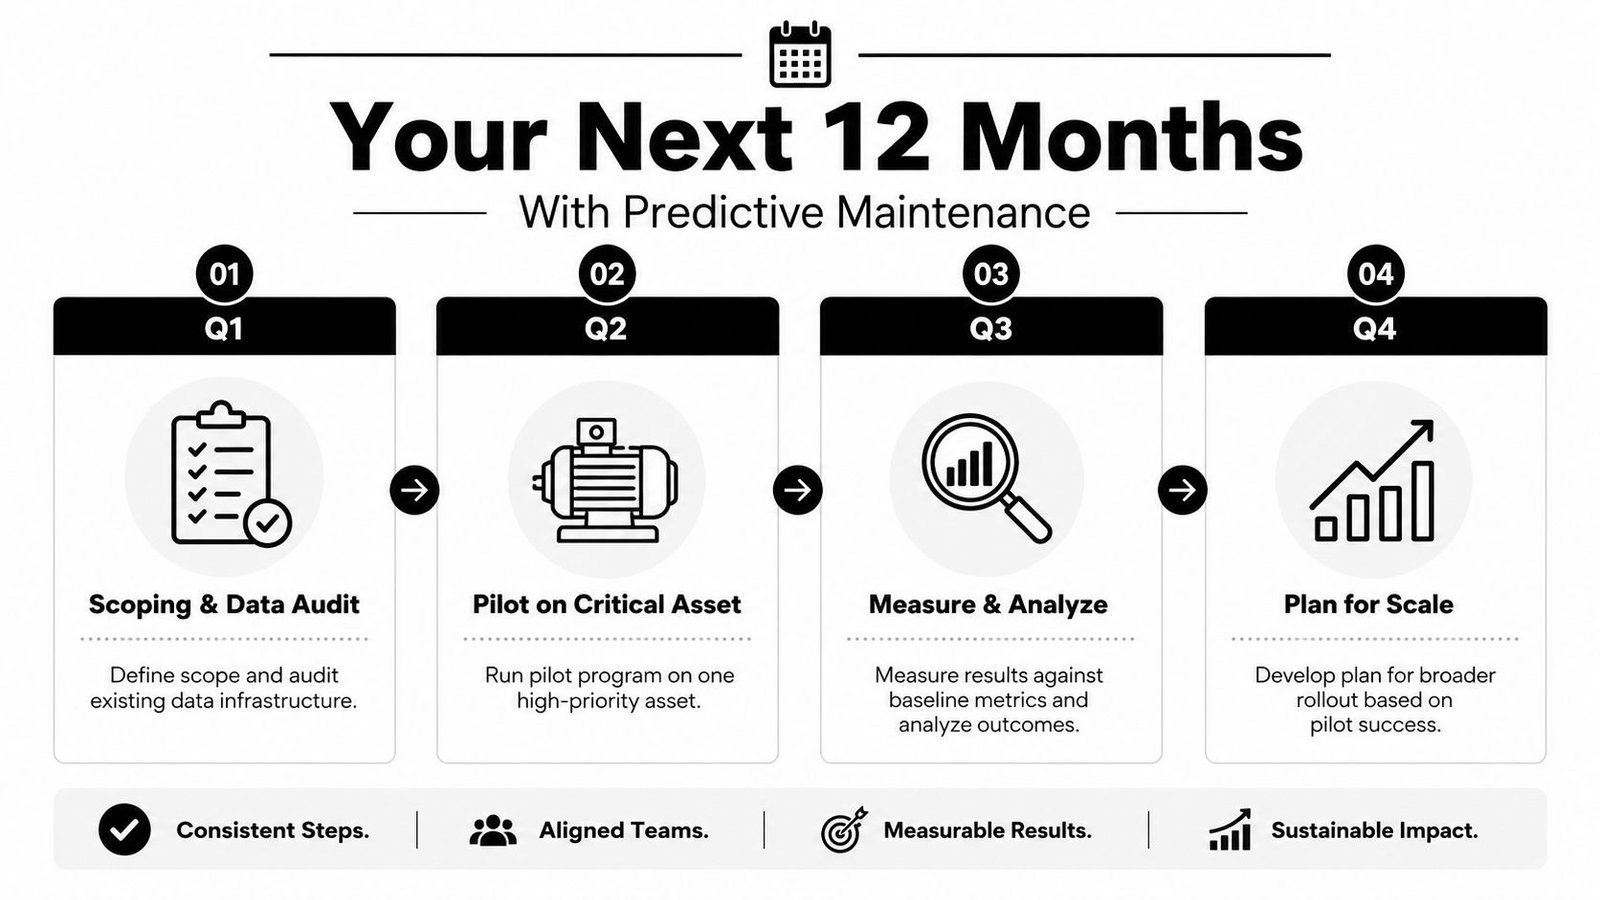
Your Next 12 Months With Predictive Maintenance
A plant manager doesn't need another abstract digital-transformation roadmap. The next year should produce a clear decision about whether PdM deserves a larger share of the maintenance budget.
Quarter one sets the boundary
Start with an asset inventory and data audit. Rank equipment by consequence and identify failure modes with measurable precursors. Review sensor locations, PLC tags, maintenance history, CMMS coding, network constraints, and GMP change-control requirements.
Quarter two proves one use case
Choose one critical, instrumentable asset. Establish normal behavior, define the alert response, train the people who will inspect the machine, and document the baseline. Don't scale because the dashboard is live. Scale only after the team can connect an alert to a verified condition and a planned action.
Quarter three measures plant value
Review downtime hours, MTBF movement, false alarms, detection time, maintenance cost per unit, and OEE contribution. Separate avoided failure value from ordinary maintenance work. If the result depends on assumptions that nobody can audit, hold the pilot and repair the measurement method.
Quarter four makes the decision
Scale when the pilot demonstrates repeatable detection, usable intervention time, technician adoption, and a defensible payback case. Hold when the system generates noise or the change-control burden exceeds the value. Kill the candidate when preventive work, inspection, redundancy, or simple replacement offers better economics.
Use this checklist in the quarterly review:
- Sensor coverage: Does each sensor observe a named failure mode, at a useful location and sampling behavior?
- Analytics evaluation: Can the vendor explain false alarms, model changes, data ownership, and export options?
- Integration design: Can the system read required PLC and equipment data without disturbing critical controls?
- GMP posture: Are calibration, software versions, access, records, and threshold changes controlled?
- ROI reporting: Are downtime, work orders, maintenance cost, quality exposure, and response time reviewed on a fixed cadence?
- Decision rule: Start PdM when you have at least three critical assets with measurable failure modes. Hold when the existing preventive program achieves above 85% schedule compliance with low reactive callouts.
Predictive maintenance is a selective engineering practice, not a universal upgrade. For small and mid-sized manufacturers, the right answer may be one pump, one chiller, one gearbox, or no PdM at all until the failure evidence improves.
System Engineering & Automation helps manufacturers choose the right level of automation, monitoring, tooling, fixtures, and integrated controls for their production goals and budget. Visit System Engineering & Automation to discuss a practical predictive-maintenance or semi-automation project, including GMP-aware design, installation, commissioning, and ongoing service support.