A process map is valuable only when it reflects real work and leads to a measurable operational decision. In manufacturing, that means more than documenting steps for an audit. The map should help an operations manager decide whether to repair a bottleneck, standardize a quality checkpoint, redesign a service handoff, add smart tooling, or justify a semi-automated or fully automated solution.
That distinction matters for teams improving production lines, medical device workflows, quality controls, maintenance services, and labor-intensive operations. A clean diagram that ignores rework, queues, operator workarounds, or system delays can create false confidence. A practical map shows what people do, why decisions change the route, and where performance suffers.
The best practices for process mapping in this guide move from scope and frontline input through metrics, notation, variation, future-state design, constraints, detailed subprocesses, governance, and automation planning. The objective is a map that supports GMP-aware execution, throughput, flexibility, quality, and realistic return on investment. In GMP-oriented environments, documentation must be accurate and controlled, but it also has to remain useful to the people responsible for producing and servicing products every day.
Table of Contents
- 1. Define Clear Process Boundaries and Scope
- 2. Involve Cross-Functional Teams from the Start
- 3. Use Standardized Mapping Symbols and Notation
- 4. Capture Cycle Times and Process Metrics
- 5. Identify and Map Decision Points and Variations
- 6. Distinguish Between Current and Future State Maps
- 7. Document Assumptions, Constraints, and Dependencies
- 8. Create Detailed Sub-Process Maps for Complex Steps
- 9. Establish a Regular Review and Update Schedule
- 10. Align Process Maps with Business Strategy and Automation Roadmap
- Top 10 Process Mapping Best Practices Comparison
- Turn the Map into the Next Manufacturing Improvement
1. Define Clear Process Boundaries and Scope
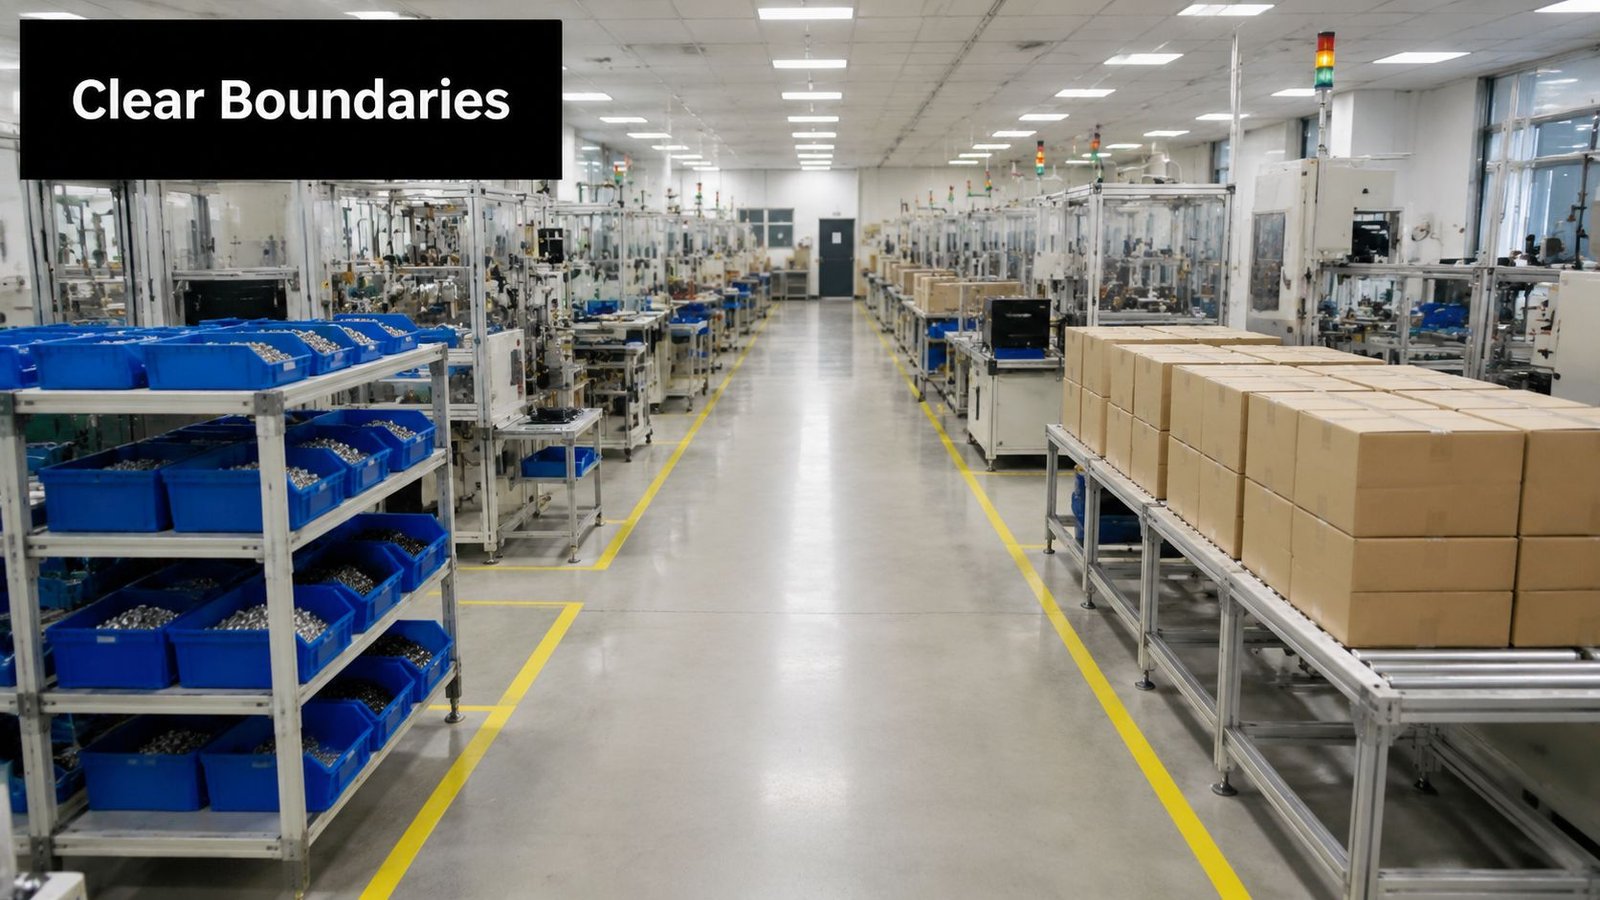
A process map needs an unambiguous start trigger and end condition. Without them, teams pull upstream suppliers, downstream logistics, support work, and unrelated approvals into one diagram until nobody knows who owns the result.
Start by naming the input that begins the process and the output that proves completion. A medical device manufacturer might map assembly from raw material arrival through final packaging, while deliberately excluding post-shipping logistics. A plant upgrading from manual workstations to semi-automated equipment might begin at operator loading and end when the automated station releases a verified part. The operator handoff must be visible because it can determine fixture design, controls, training, and safety requirements.
Set boundaries before collecting detail
A kickoff with operations managers, floor supervisors, quality leads, maintenance, and engineering gives the team a shared definition before observation begins. A SIPOC template, covering suppliers, inputs, process, outputs, and customers, can make those limits easier to challenge and confirm.
Record boundary decisions in the project file. This simple control prevents scope drift and avoids duplicate mapping by production, quality, and engineering teams working on overlapping sections.
Practical rule: If the team can't state where the process starts, where it ends, and who owns the output, it isn't ready to design automation around it.
Revisit the boundary after the first observation cycle. Teams often discover that a supposedly minor handoff, such as quality release before packaging, determines the actual flow. Include that handoff when it affects compliance, throughput, labor, or equipment selection.
2. Involve Cross-Functional Teams from the Start
The documented procedure rarely captures every action required to keep a line moving. Operators know which parts need reorientation, supervisors know where queues build, quality inspectors know which checks are skipped under pressure, and maintenance technicians know which equipment conditions force a workaround. A process map built from one office perspective will miss those realities.
Use observation sessions as well as workshops. A neutral facilitator can ask direct questions without making operators feel that the exercise is an audit of individual performance. Schedule participation across shifts so the map doesn't represent only the habits of one crew.
Reconcile conflicting versions of reality
Manufacturing teams often encounter three different stories:
- Frontline practice: What operators do to complete the work.
- Supervisor expectation: What the production standard says should happen.
- System evidence: What equipment, MES, quality, or maintenance logs record.
Don't erase the conflict. Mark it, investigate it, and decide which source represents the controlled process. If operators manually reorient parts between stations to prevent jams, that step belongs in the current-state map even if it doesn't appear in the work instruction. If a GMP checkpoint appears in the procedure but not in observed practice or records, quality leadership must resolve the gap before automation proceeds.
Cross-functional involvement also improves adoption. Operators are more likely to use a revised workstation or fixture when they helped define the problem. Quality teams can identify where controls must be built into equipment, while engineers can distinguish a genuine automation opportunity from a training or maintenance issue.

3. Use Standardized Mapping Symbols and Notation
A process map should be readable without a private explanation from its author. Standardized symbols create a shared visual language for operators, engineers, quality personnel, finance teams, and leadership reviewing an automation proposal.
Use rectangles for activities, diamonds for decisions, and clear start and end markers. Swimlane diagrams are especially useful when work crosses departments or equipment boundaries. A lane for production, another for quality, and another for automated equipment can show exactly where manual assembly transitions to automated torque testing. That view makes ownership and potential automation value easier to discuss.
Choose one visual language for the site
A manufacturer may adopt ANSI Y15.3 flowchart conventions or Lean and Six Sigma swimlane conventions. The choice matters less than consistent use. Create a one-page symbol guide, place it with the mapping template, and include approved examples in onboarding and process training.
Color can add meaning, but it must not carry meaning alone. For example, red may identify GMP-critical steps and blue may identify support activities. Add a legend and text labels so the map remains understandable when printed or viewed by people with color-vision differences.
Tools should support the method, not replace it. Visio, Lucidchart, and open-source diagramming tools can provide symbol libraries and versioned files. A quantitative study of process mapping practices reported strong use of flowcharts, swimlane diagrams, routine map updates, employee training, and digitized documentation, with flowcharts rated 4.01 out of 5, swimlane diagrams 3.87 out of 5, routine updates 3.98 out of 5, training 4.11 out of 5, and digitized documentation 3.79 out of 5. The findings are reported in this quantitative study of process mapping practices.
Don't make every map technically elaborate. A notation system succeeds when a shift supervisor can identify the next action, owner, decision rule, and required record quickly.
4. Capture Cycle Times and Process Metrics
A map without metrics describes motion but not performance. Record the time spent doing work, waiting, transferring, inspecting, correcting, and changing over. Also capture defects, rework, downtime causes, work-in-process, batch size, and ownership for each major step.
The distinction between process time and lead time is essential. Process time is the time people or equipment actively perform work. Lead time is the elapsed time from when work becomes available until it is completed and passed onward. The activity rate can then be calculated as (PT ÷ LT) × 100, while rolled first pass yield multiplies the complete-and-accurate percentage at each step. These definitions and calculations are explained in this metrics-based process mapping resource.
Build an evidence base for automation
Collect observations across normal operating conditions, different products, shifts, and operator experience levels. Time-motion studies and video analysis can expose small repeated actions that are invisible in a high-level workshop. Establish a baseline before changing the process so the team can compare outcomes after installing a fixture, control, or automated station.
Manufacturing teams should connect the map to measures such as overall equipment effectiveness, scrap and rework rate, cycle time, on-time delivery, and labor productivity. One industry guide recommends target ranges of a 10% to 20% OEE increase, 15% to 25% scrap and rework reduction, 10% to 30% cycle-time reduction, 5% to 15% on-time-delivery improvement, and 15% to 25% labor-productivity gain after mapping-driven improvement. Treat these as planning ranges, not promises, and review the assumptions behind them in the manufacturing process mapping efficiency guide.
If cycle time is the primary constraint, use this resource on reducing cycle time in manufacturing to connect mapping findings with practical engineering decisions.
5. Identify and Map Decision Points and Variations
Manufacturing processes don't follow one perfectly straight route. Inspection results, material condition, customer requirements, equipment status, and documentation errors can send work into rework, quarantine, expedited handling, or scrap.
Show every meaningful branch and define the rule behind it. A precision machining operation might route parts to acceptance, on-site rework, or scrap after inspection. A medical device assembly process may send a unit into a controlled rework loop after a sterility or documentation failure. The map should show who makes the decision, what evidence they use, what record they create, and what happens next.
Map exceptions as operational data
A high-mix environment often gets more value from mapping variation than from drawing a polished happy path. Track how often each branch occurs using inspection records, nonconformance reports, rework logs, and production data. Don't add unsupported frequencies to the map, but don't hide them either. A branch that appears infrequently may still carry significant quality or compliance risk.
Use separate sub-process maps when decision logic becomes difficult to read. Quality leads and inspectors should verify acceptable ranges, visual standards, disposition rules, and escalation requirements. Engineers can then determine whether a PLC, programmable inspection sequence, barcode rule, or poka-yoke fixture can enforce a repeatable decision.
Automation isn't automatically the right response. If a decision depends on expert judgment and product mix changes often, assisted inspection may be more practical than full automation. If the rule is stable, measurable, and repeated, automated verification may reduce variation while preserving a clear electronic record.
6. Distinguish Between Current and Future State Maps
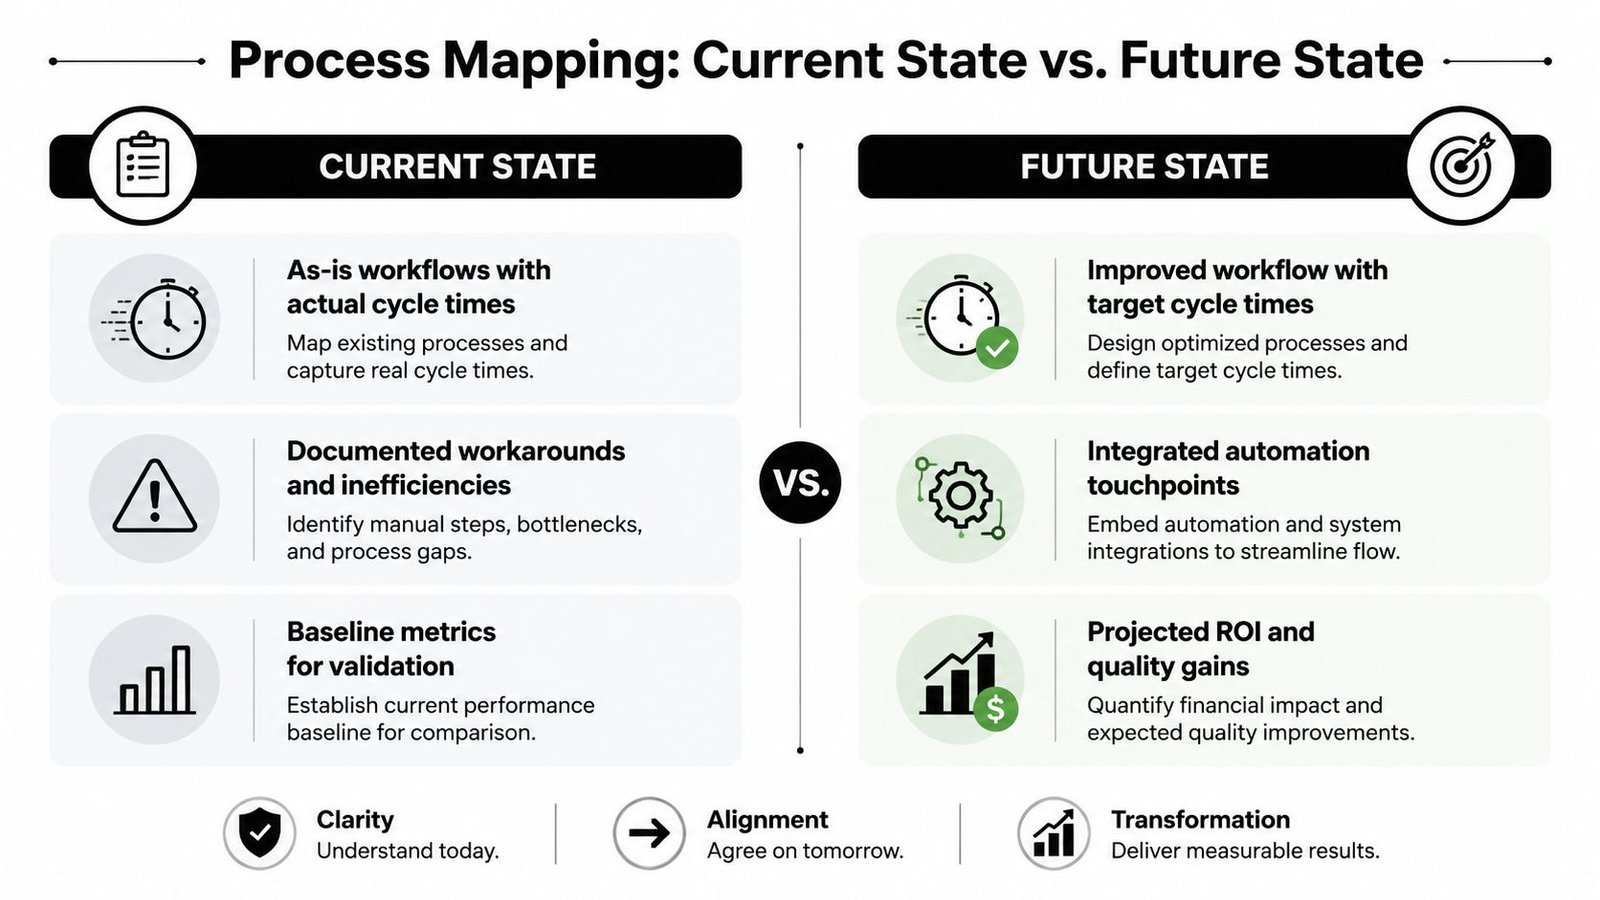
Current-state and future-state maps answer different questions. The current state asks, What happens now, including workarounds and delays? The future state asks, What should happen after the approved improvement is implemented?
Complete and validate the current state first. A future-state design built on assumptions can remove a visible manual task while leaving the core constraint untouched. For example, a manual assembly map may show a long sequence of handling, inspection, and recording. The future state might introduce semi-automated fixtures, integrated quality checks, and automated data capture, but only after the team verifies the actual source of delay and error.
Make the transition executable
Show the equipment, people, controls, records, and dependencies that will change. A medical device manufacturer could depict barcode-tracked fixtures, automated quality recording, and controlled material movement in the future state. A general production line might replace repetitive loading with a smart fixture while retaining operator judgment for product-specific decisions.
Keep the future state realistic. It should account for validation, training, maintenance, line clearance, changeover, and release requirements in GMP-aware environments. A fully automated concept may look efficient on paper but create inflexible changeovers or expensive validation work. A semi-automated design may deliver better value when volumes, product variants, or budgets remain uncertain.
Document assumptions about demand, staffing, cycle time, equipment capability, and quality performance beside the future-state map. Phase changes instead of forcing every improvement into one launch. The future state should guide investment, not conceal risk.
7. Document Assumptions, Constraints, and Dependencies
A map can be accurate for one set of conditions and misleading under another. Staffing, product mix, equipment availability, supplier material, customer demand, external testing, and maintenance status all shape the flow. Write those conditions down instead of allowing them to remain hidden in the project team's memory.
Create an assumptions and constraints record linked to the map. Note which statements are verified, which are estimates, and which require testing. Flag risks visually, but explain them in words. “Equipment available” isn't enough. The team needs to know whether that means available during every shift, available after planned maintenance, or available only for a pilot.
Test the conditions that drive the business case
An automation proposal may depend on stable material dimensions, consistent part presentation, reliable data capture, or a quality decision that can be expressed as a measurable rule. If a supplier's variation affects loading, an incoming inspection or measurement check may be more valuable than a faster actuator. If downtime is the dominant constraint, adding automation to a starved station won't improve the complete system.
Review assumptions when volumes, staffing, suppliers, equipment, or regulations change. Small pilots can test fixture fit, operator interaction, control logic, inspection repeatability, and cleaning requirements before a full system is approved.
A future-state map is only as credible as the constraints written beside it.
This discipline also supports GMP-aware execution. Quality and validation teams can identify which elements require controlled change, documented approval, qualification, or revalidation. Engineering can then separate a straightforward tooling improvement from a system change that affects validated records or product release.
8. Create Detailed Sub-Process Maps for Complex Steps
A high-level map should explain the whole flow without forcing readers through every hand movement. Detailed subprocess maps belong beneath the overview, attached to steps where time, defects, risk, or cost justify deeper analysis.
Prioritize assembly-intensive work, inspection and sorting, material handling, cleaning, changeover, and documentation activities. A surgical instrument manufacturer might map the main assembly route first, then expand the sterilization cleaning process to identify where a cleaning fixture could improve consistency. A precision component producer might drill into visual inspection and sorting to evaluate inline measurement or automated classification.
Preserve detail without creating clutter
A subprocess map should show one action per step, the responsible person or equipment, inputs and outputs, decision points, records, and rework loops. Use video or time-motion observation where actions are fast, repetitive, or difficult to recall accurately. Keep each detailed map readable by limiting it to a manageable sequence of main steps rather than putting every micro-motion on one page.
The study of mapping practices cited earlier reported tool usage of Lucidchart at 36%, Bizagi at 28%, Visio at 20%, and manual methods at 16%. Those figures support a practical conclusion: a digital tool is useful, but training, standard notation, and regular refreshes matter just as much as the platform.
Place the detailed map where the engineering team can use it to design a fixture, sensor, control sequence, workstation, or assisted inspection method. Keep the operator-facing version focused on safe, compliant execution. Don't expose users to engineering detail they don't need.
9. Establish a Regular Review and Update Schedule
A process map becomes dangerous when people trust it after the process has changed. Products are modified, equipment is upgraded, suppliers change, and operators develop workarounds. In a GMP-aware facility, the map must also remain aligned with controlled procedures, training, records, and approved changes.
Assign a process owner with authority to coordinate updates. Set a review trigger for routine intervals and another for significant events, including equipment changes, repeated deviations, new products, recurring quality issues, or major volume shifts. A short review can confirm that the map still matches reality. A major change may require a complete remap and formal quality review.
Govern the map like an operating asset
Use simple version control, such as a filename containing the process name, revision, and period. Store the approved version in a controlled location, archive superseded versions, and link related work instructions, validation records, risk assessments, and training materials.
The review should compare three things: observed work, approved documentation, and system records. When they disagree, don't edit the map to match the most convenient version. Determine whether the process needs standardization, the procedure needs revision, the equipment needs repair, or the data capture needs improvement.
A quarterly review might reveal that operators changed an assembly sequence because a jig was unreliable. The right response could be jig repair, new fixture design, or a controlled procedure change. Use manufacturing process improvement support from SEA when the review identifies an equipment, tooling, or workflow issue that requires engineering action.
10. Align Process Maps with Business Strategy and Automation Roadmap
Mapping every process can consume time without improving the business. Start with the outcome leadership needs, such as higher throughput, better quality, lower labor dependency, safer work, stronger service performance, or more reliable compliance. Then rank processes by operational impact and the strength of the evidence behind the improvement opportunity.
For a medical device manufacturer, a quality inspection map may support both GMP adherence and production flow. That map could reveal a suitable role for vision inspection, measurement fixtures, controlled data capture, or operator guidance. For a small or mid-sized manufacturer, a labor-intensive assembly map may point toward smart tooling or a semi-automated workstation rather than a fully automated line.
Match automation level to process reality
Use the map to distinguish among three options:
- Manual improvement: Standardize work, repair equipment, improve training, or redesign the layout when variation and volume don't justify automation.
- Semi-automatic solution: Add fixtures, sensors, guided loading, automated checks, or integrated controls while retaining operator flexibility.
- Full automation: Use automated handling, inspection, controls, and data capture when the process is stable, measurable, and capable of supporting the required investment and maintenance.
Document expected effects on cost, quality, throughput, safety, flexibility, and compliance. Finance needs more than a diagram. It needs a traceable link between the current constraint, the proposed intervention, the required investment, and the expected operating result.
A global BPM survey found that 50% of 4,412 BPM professionals said their organizations began creating process maps without a process architecture, while only 25% had detailed architecture before mapping. The same survey reported continuous improvement as a top objective for 67%, with knowledge management at 44.34% and process automation at 43.50%. Its global BPM survey findings support a strong manufacturing practice: establish enterprise process architecture, then map end to end so local maps contribute to improvement, automation targeting, and knowledge transfer.
For a practical connection between mapping and equipment decisions, review SEA's process improvement and automation approach.
Top 10 Process Mapping Best Practices Comparison
| Item | Implementation Complexity 🔄 | Resource Requirements ⚡ | Expected Outcomes ⭐ | Ideal Use Cases 📊 | Key Advantages ⭐ | Quick Tip 💡 |
|---|---|---|---|---|---|---|
| Define Clear Process Boundaries and Scope | Medium 🔄 (stakeholder alignment) | Low–Medium ⚡ (workshops, documentation) | Clear scope; reduced rework ⭐⭐⭐⭐ | Early-stage mapping; pre-automation planning 📊 | Prevents scope creep; clarifies automation targets ⭐ | Run a kickoff with ops & QA; document boundaries |
| Involve Cross-Functional Teams from the Start | High 🔄 (coordination across roles) | Medium–High ⚡ (time, facilitator) | Accurate maps; buy-in; hidden issues uncovered ⭐⭐⭐⭐⭐ | Complex workflows; change initiatives 📊 | Captures tacit knowledge; reduces rollout delays ⭐ | Use a neutral facilitator; include multiple shifts |
| Use Standardized Mapping Symbols and Notation | Low–Medium 🔄 (training & governance) | Low ⚡ (templates/software) | Consistent interpretation; audit-ready documentation ⭐⭐⭐⭐ | Multi-site or regulated environments 📊 | Reduces ambiguity; eases vendor communication ⭐ | Publish a one-page symbol guide; use standard tools |
| Capture Cycle Times and Process Metrics | Medium–High 🔄 (data collection & analysis) | Medium–High ⚡ (timing tools, logs) | Quantified ROI; bottleneck identification ⭐⭐⭐⭐⭐ | High-volume lines; ROI justification for automation 📊 | Evidence-based decisions; validates improvements ⭐ | Collect 2–4 weeks of data; segment by shift/product |
| Identify and Map Decision Points and Variations | High 🔄 (complex branching & logic) | Medium ⚡ (inspection/defect data) | Reduced variability; targeted automation points ⭐⭐⭐⭐ | Processes with inspections, rework, or routing rules 📊 | Enables poka-yoke and automated routing ⭐ | Quantify branch frequencies; use sub-maps for branches |
| Distinguish Between Current and Future State Maps | Medium 🔄 (dual perspectives) | Medium ⚡ (planning & validation) | Clear improvement roadmap; measurable targets ⭐⭐⭐⭐ | Improvement programs; automation planning 📊 | Prevents confusion; guides phased implementation ⭐ | Validate current state first; phase future changes |
| Document Assumptions, Constraints, and Dependencies | Medium 🔄 (analysis & verification) | Low–Medium ⚡ (stakeholder input) | Risk-aware plans; fewer surprises during deployment ⭐⭐⭐⭐ | Automation feasibility studies; pilot planning 📊 | Reduces failed implementations; clarifies limits ⭐ | Flag risky assumptions and validate with pilots |
| Create Detailed Sub-Process Maps for Complex Steps | High 🔄 (deep drill-down) | High ⚡ (time, video/time-motion) | Targeted improvements; engineering-ready detail ⭐⭐⭐⭐ | Assembly-intensive or high-defect steps 📊 | Provides specs for tooling/fixtures; reduces errors ⭐ | Prioritize steps consuming >20% cycle time; video it |
| Establish a Regular Review and Update Schedule | Low–Medium 🔄 (governance discipline) | Low ⚡ (owner time; periodic reviews) | Current, compliant maps; reduced process drift ⭐⭐⭐⭐ | GMP environments; dynamic production lines 📊 | Prevents drift; supports audits and training ⭐ | Assign a Process Owner; use simple versioning |
| Align Process Maps with Business Strategy and Automation Roadmap | Medium–High 🔄 (strategic alignment) | Medium ⚡ (leadership time; analytics) | Prioritized investments; faster approvals ⭐⭐⭐⭐ | Capital planning; executive sponsorship required 📊 | Focuses resources on high-impact processes ⭐ | Link maps to ROI metrics and present quarterly to leadership |
Turn the Map into the Next Manufacturing Improvement
A process map shouldn't end as a polished file in a shared folder. It should create a prioritized action. That action might be repairing a fixture, removing a duplicate entry, standardizing an inspection decision, changing a handoff, reducing a queue, improving a service workflow, or evaluating a right-sized automation opportunity.
Start with scope. Define the trigger, the completion condition, the owners, and the outputs. Then validate the map with operators, supervisors, quality personnel, maintenance, engineering, and anyone responsible for related service or production records. This sequence prevents the team from designing solutions around an incomplete view of the work.
Measure the flow instead of relying on impressions. Capture process time, lead time, waiting, changeovers, defects, rework, downtime, work-in-process, and ownership. A value stream map should show both material and information flow, not only the movement of parts. The manufacturing guidance on using value stream mapping for process optimization emphasizes the importance of capturing cycle time, wait time, changeover time, defect points, downtime causes, work-in-process, batch size, and step ownership.
Quantify waste categories where possible. One manufacturing value stream mapping case study reported transportation at 23.88%, motion at 21.64%, waiting at 18.65%, inventory at 10.44%, defects at 8.96%, over-processing at 8.71%, and over-production at 7.72%. The manufacturing case study on waste categories shows why “inefficiency” is too broad to guide an engineering decision. Transportation calls for a different response than defects, and waiting calls for a different response than over-processing.
Compare the validated current state with a future state that includes real constraints. Identify what remains manual, what receives assistance, and what could be fully automated. Test assumptions through pilots before committing to a major system. In GMP-aware environments, include document control, quality approval, validation, training, maintenance, and data integrity in the future-state design.
Finally, assign ownership and schedule review. A process map that no longer reflects work can misdirect training, audits, improvement projects, and automation investment. Keep the map connected to performance reviews and change control so it remains a working engineering asset.
Manufacturing teams don't need automation for its own sake. They need solutions that improve quality, efficiency, safety, service, and resilience within real production constraints. When the map shows a repeatable problem and the evidence supports intervention, it becomes a strong starting point for a conversation about tooling, fixtures, controls, semi-automatic systems, or fully automated equipment.
System Engineering & Automation provides cost-effective manufacturing engineering and automation solutions, including manual equipment, custom tooling, fixtures, integrated controls, semi-automatic systems, and fully automated equipment. Visit System Engineering & Automation to turn your process map into a practical improvement plan supported from concept and design through manufacturing, installation, commissioning, and ongoing service.