Your line is running, the schedule looks full, and the operators are still chasing the same problems every week. A fixture drifts out of tolerance, a sensor throws nuisance alarms, a changeover takes longer than it should, and production loses another hour while someone hunts for the right part, the right print, or the last clean repair note. That is what a weak equipment maintenance program looks like on the shop floor, not a binder of PMs, but a collection of guesses that only becomes visible when the line stops.
Table of Contents
- When Maintenance Quietly Stops Production
- Building the Asset Register and Criticality Tiers
- Preventive Versus Predictive Tasks and When Each Earns Its Place
- Job Plans, Acceptance Criteria, and GMP Evidence in One Record
- Spare Parts and Calibration Stocks Tied to Criticality
- Metrics That Actually Move the Program Forward
- A 90-Day Rollout for Your First Stable Program
When Maintenance Quietly Stops Production
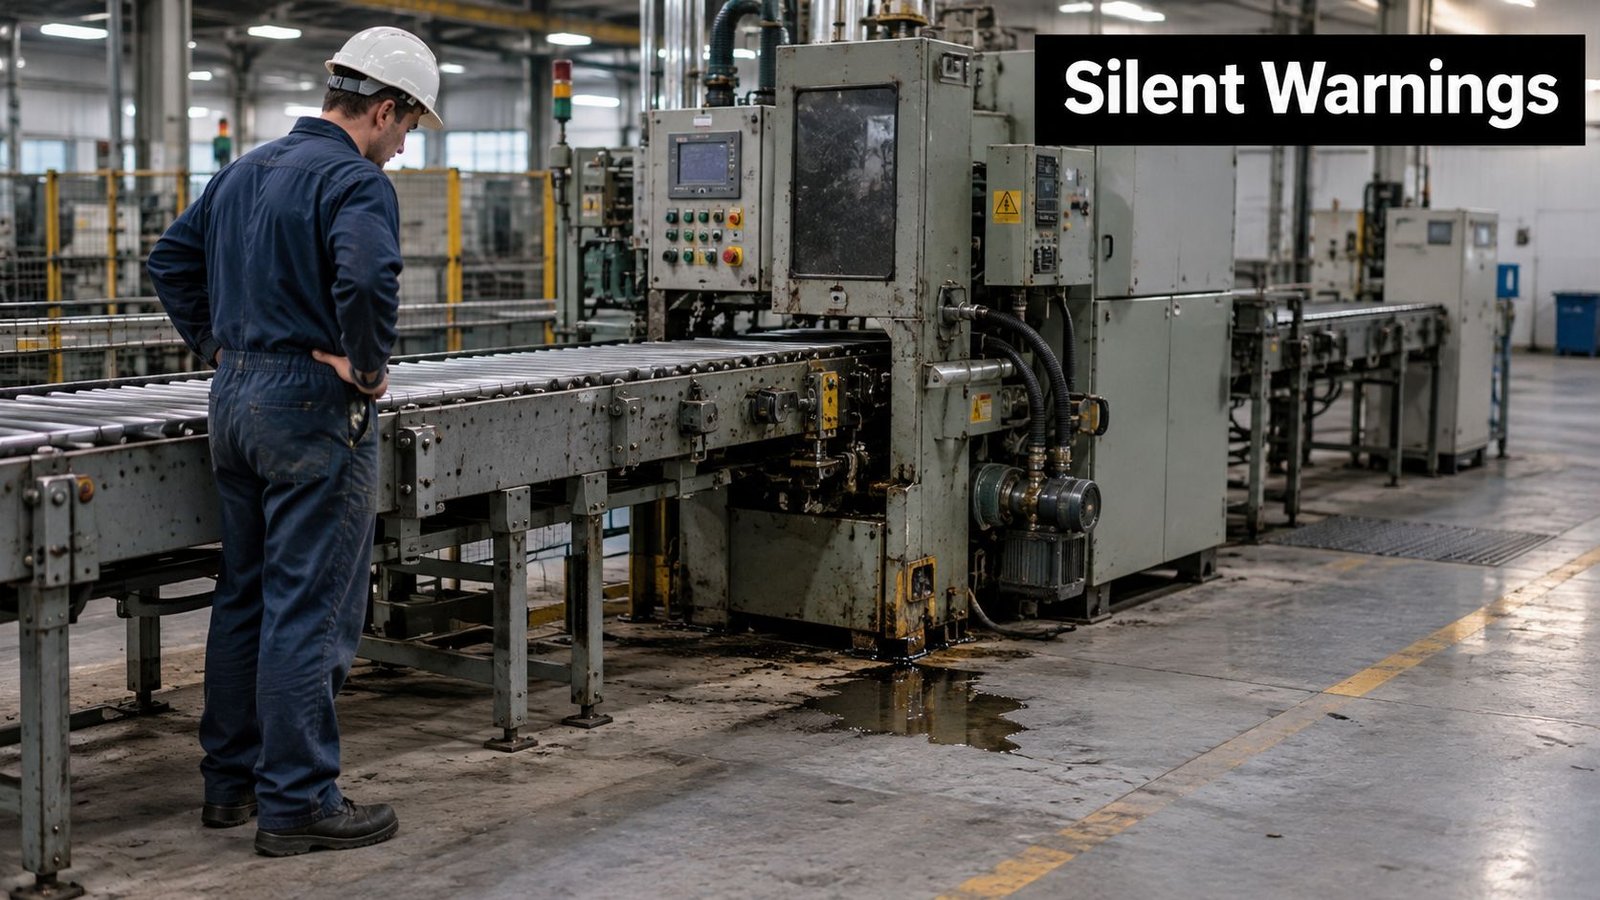
The failure that hurts most usually doesn't look dramatic at first. A semi-automatic station in a medical-device cell starts missing its pickup point by a small amount, the operator nudges the fixture, and the team keeps going because the shift is already behind. By the time anyone calls maintenance, the problem isn't the one broken part, it's the stack of small misses that nobody baselined, tracked, or tied to a decision.
That's why an equipment maintenance program has to be treated as a production-control system, not a repair schedule. NIST found that surveyed manufacturing establishments averaged 45.7% reactive maintenance, 31.8% preventive maintenance, and only 17.3% predictive maintenance (NIST research on advanced machinery maintenance). That mix tells the whole story. Most plants still wait until the asset is already hurting throughput, quality, or both.
Practical rule: if your team can't explain why a failure happened, what changed before it happened, and what decision should change next time, you don't have a program. You have a cleanup crew.
The cost of that habit isn't abstract. NIST estimated total annual maintenance-related costs and losses at $222.0 billion for U.S. manufacturing, and the weaker reactive-heavy group had 52.7% more unplanned downtime and 78.5% more defects than the stronger preventive and predictive group (NIST maintenance survey). That is the business case. Maintenance is not overhead sitting off to the side of production. It is one of the controls that decides whether your line holds rate, holds quality, and holds customer commitments.
Disciplined operations and maintenance work also pays back without a giant capital project. The U.S. Department of Energy says well-targeted operations and maintenance programs can reduce energy bills by 5% to 20% without significant capital investment (DOE O&M guide). That matters because plants often waste money in two directions at once, first by under-maintaining assets, then by overspending on emergency labor, overtime, and avoidable energy waste.
The maintenance mix you should target is simple. Push reactive work down hard, keep preventive work strong on assets with clear wear patterns, and reserve predictive monitoring for the failures that are expensive, hard to see, or dangerous to miss. If your plant is still stuck in run-to-failure habits, the problem is rarely the absence of sensors. It's weak work-order discipline, missing failure history, and leadership that treats maintenance as a support function instead of a control function.
A useful place to start is with your troubleshooting habits. If your current response model is still too loose, this equipment troubleshooting guide is worth reviewing, because the best maintenance programs are built on fast diagnosis, not heroic guessing.
Building the Asset Register and Criticality Tiers
Every strong maintenance program starts with an inventory that reflects how the line behaves. Not a purchasing list, not a room-by-room asset dump, but an asset register that records what the machine does, how it fails, what it costs you when it slips, and how long you'll wait for the right spare. If the register doesn't include failure modes, safety and quality consequences, operating hours, spare-part lead times, and historical work orders, you're not ranking risk, you're guessing at it.
Put the right fields in the register
A practical register should capture the functional role of the asset, the likely failure modes, and the consequences of each failure mode. It should also show which assets are tied to throughput, which ones affect product conformance, and which ones can limp along without creating immediate pain. DOE guidance is blunt on this point, a maintenance program should create an asset register with those fields, then perform criticality analysis to assign each failure mode to preventive, predictive, or run-to-failure control (DOE standard).
A Tier A asset is not just expensive. It's the one that can stop shipment, trigger quality fallout, or create safety risk. That usually means your semi-automatic fixtures, key sensors, control cabinets, and bottleneck stations deserve the most disciplined treatment. Tier B assets get scheduled preventive work because their failure is real but manageable. Tier C assets can stay on a documented run-to-failure basis when the consequence is low and replacement is straightforward.
| Asset | Safety/Quality Impact | Downtime Impact | Recommended Tier | Maintenance Strategy |
|---|---|---|---|---|
| Semi-automatic assembly fixture | High, can shift part location and compromise fit | High, stops the cell | Tier A | Preventive checks plus condition monitoring |
| Packaging station | Medium, can create labeling or handling errors | Medium, slows output | Tier B | Scheduled preventive work |
| Inspection station | High, can release bad product if drift goes unnoticed | High, blocks release | Tier A | Preventive calibration with selective predictive checks |
Practical rule: if a failure can create bad product before anyone notices, it belongs in the highest tier until evidence proves otherwise.
The point of the tiers is to stop treating every asset the same. A packaging motor and a final inspection system do not deserve the same attention or the same spare-part policy. If the same hour of labor is available to spend, criticality decides where it does the most good. That's how you stop wasting time polishing low-risk assets while the bottleneck equipment keeps stealing production.
For teams that support manufacturing solutions across mixed lines, this tiering also keeps the conversation honest. A smaller plant doesn't need to instrument everything. It needs a defensible list that says what gets scheduled, what gets watched, and what gets left alone until the data says otherwise.
Preventive Versus Predictive Tasks and When Each Earns Its Place
Preventive and predictive maintenance get talked about like competing philosophies. They aren't. Preventive work is the backbone, predictive work is the selective layer you add when the failure mode is worth watching. If a plant blurs that distinction, it usually ends up with sensors everywhere and no one who knows what to do when the alarm trips.
Preventive work belongs on the calendar
Preventive maintenance is straightforward. It covers scheduled inspections, alignments, calibrations, overhauls, and replacements. On a semi-automatic line, that means checking fixture wear, tightening critical fasteners, verifying motion paths, replacing wear components before they turn into slop, and keeping the equipment in a known state. It's boring, and that's exactly why it works.
Predictive maintenance uses continuous or periodic measurements, such as temperature, noise, and vibration, to forecast degradation before the failure lands. That sounds more advanced, but the 2025 manufacturing data says execution still lags badly. A survey of 800 decision-makers found 94% had experienced unexpected downtime, while only 21% had predictive maintenance fully deployed at scale, and 63% were still piloting it in limited areas (2025 manufacturing service report). The lesson is obvious. Most plants are not short on technology. They're short on operational discipline.
Use a staged rule, not a wish list
Start with the preventive tasks that are easy to define and hard to dispute. Then add predictive monitoring only where the failure consequence justifies the extra effort. A spindle drive that damages a critical process path deserves vibration monitoring. A control cabinet with recurring thermal stress deserves thermal scans. A pick-and-place head with cycle-time drift may justify trend tracking if the drift is tied to quality or throughput.
Sensors don't fix weak maintenance. They only make weak maintenance more visible.
The trap is buying instrumentation before you've cleaned up the work order process, the downtime coding, and the alert-response rules. If nobody owns the alarm, if severity isn't defined, and if the corrective action isn't documented, the plant just creates alert fatigue. That's not predictive maintenance. That's noise with a dashboard.
For a production team, the practical order is simple. Stabilize the preventive baseline first. Instrument the failures that are expensive, difficult to inspect, or tied to compliance. Leave the rest on a documented schedule and keep the decision on one sheet, not in someone's head.
Job Plans, Acceptance Criteria, and GMP Evidence in One Record
A job plan is where maintenance stops being theory and starts being proof. If the work order doesn't tell a technician how to isolate the equipment, what parts to use, what to inspect, what to accept, and when to escalate, then the result will vary by shift and by person. That's tolerable on a bench grinder. It's not acceptable on regulated production.
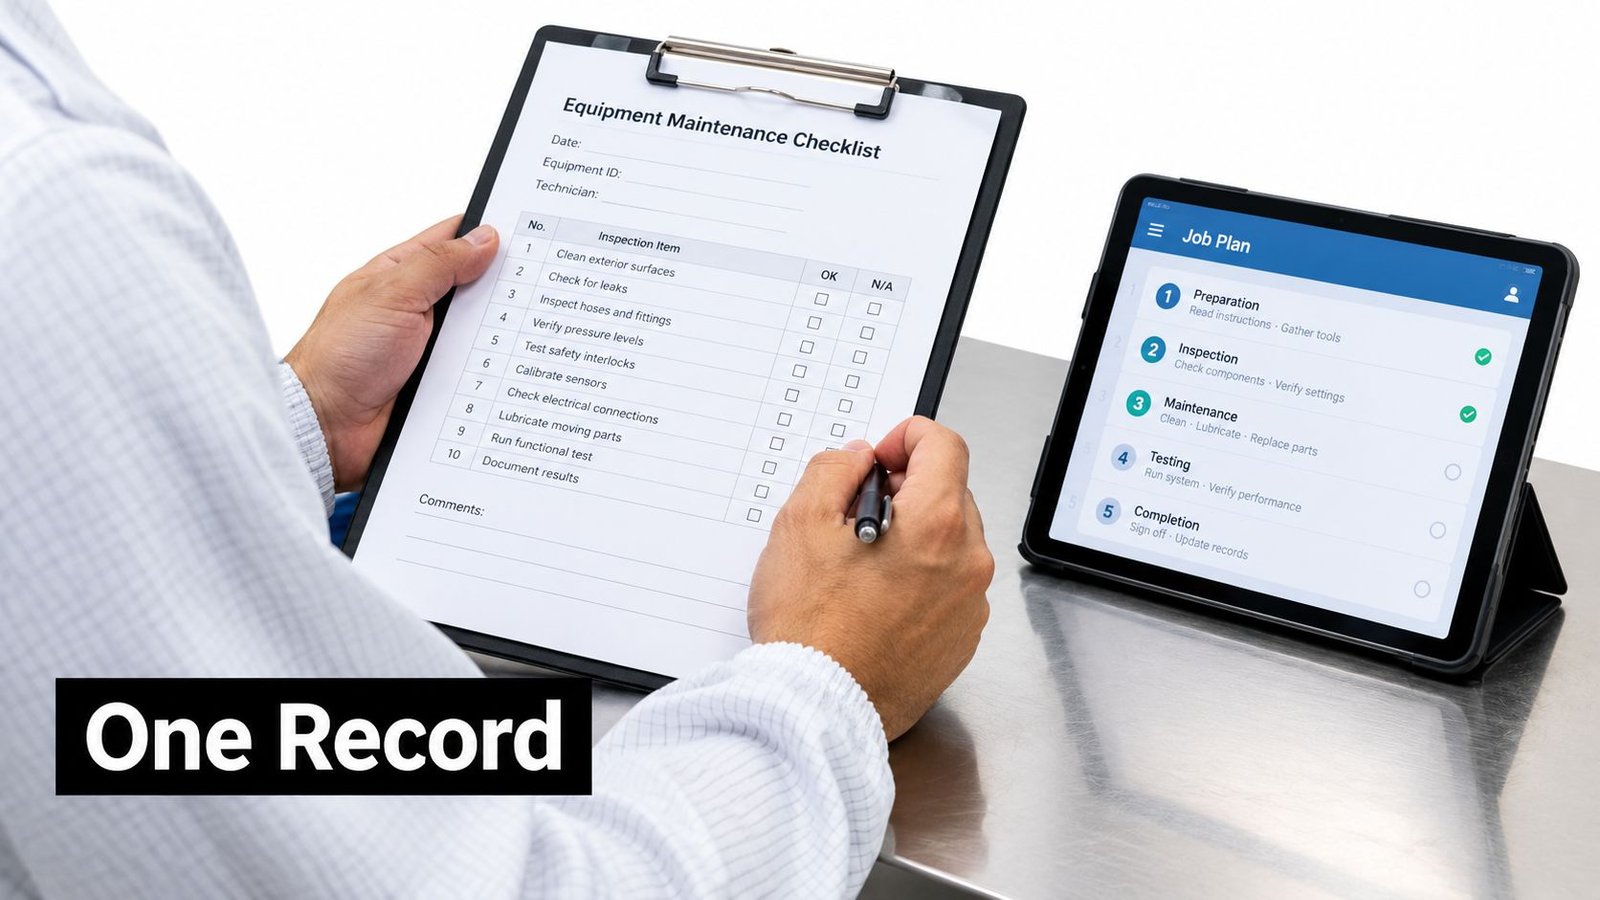
A good job plan is specific. It names the isolation and lockout steps, lists the tools and parts, defines the inspection points, and states the acceptance limits. It also tells the technician what to photograph or record, and what happens if the result is outside tolerance. That's how you reduce variation from one service event to the next.
FDA quality-system guidance is clear that manufacturers should qualify equipment installation, maintain and calibrate equipment, establish maintenance schedules and procedures, and perform documented periodic inspections, while designing and maintaining equipment to facilitate cleaning, adjustment, and use (FDA quality system overview). For medical-device and GMP-aware production, that means the maintenance record has to do more than prove a wrench was turned. It has to support the state of control.
The best plants classify maintenance work by regulatory impact. Some tasks are routine like-for-like work. Some require verification or calibration before release. Some require formal change control or requalification. If you lump all of that into one generic PM bucket, you'll eventually create a documentation gap that quality has to clean up after the fact.
The same record should also capture calibration status, software configuration if it changed, and first-piece results before production restarts. That isn't paperwork for its own sake. It protects the line from hidden drift, and it protects the company when an auditor asks why a machine was fit for use after service.
If you're supporting semi-automatic systems, fixtures, tooling, or integrated controls, the maintenance record should be treated as part of the quality system, not a separate admin task. That's the point where maintenance becomes evidence, and evidence is what keeps production release defensible.
Spare Parts and Calibration Stocks Tied to Criticality
Spare parts are where plants either tie up cash or lose hours. Most warehouses carry too much of the wrong stuff and too little of the parts that stop production. The fix is not a bigger storeroom, it's a better rule for what stays on the shelf.
The stock policy should follow the criticality tier. Tier A assets justify minimum-on-hand quantities for long-lead or single-source parts, especially where a delay means downtime you can't absorb. That can include servo-drive repair kits, specialized sensors, or proprietary motion components. Tier B assets usually need consumable wear parts sized to the service interval and the likely replacement cycle.
Calibration stock deserves the same discipline. Reference tools, torque standards, pressure standards, and traceable gauges should be controlled, identified, and kept current. If the calibration tool is unreliable, every downstream measurement becomes shaky too.
Here's the rule I'd use on the floor. If a part has no recorded failure history and no criticality justification, don't stock it just because it feels safer. Stocking without evidence turns the warehouse into a museum of expensive guesses. If you need a practical way to clean that up, this spare parts inventory management guide gives a useful starting point.
A servo-drive repair kit for a bottleneck station is a good example of a justified stock item. A bag of generic fasteners for a noncritical support frame is not. A fixture locator set for a Tier A assembly cell may deserve control and traceability. A calibration standard tied to product release absolutely does.
Practical rule: every stocked part should trace back to a failure, a lead-time risk, or a documented criticality decision. Anything else is just carrying cost with a label on it.
That mindset also keeps maintenance, quality, and purchasing aligned. Maintenance stops asking for every part under the sun. Purchasing stops getting emergency expedites for things nobody planned. And the plant stops paying to store parts that never had a business case.
Metrics That Actually Move the Program Forward
Most maintenance boards are full of activity counts and empty of consequences. Completed work orders, technician utilization, PM compliance on paper, all of that can look healthy while the line is still bleeding uptime. If you want a program that improves production, the scoreboard has to measure what the plant feels.
Track outcomes, not just effort
The core measures are planned-maintenance compliance, schedule compliance, mean time between failures, mean time to repair, unplanned downtime, maintenance cost per operating hour, defect or scrap rate, and repeat failures on the same asset. Those are the numbers that tell you whether maintenance is protecting throughput and quality or just keeping people busy. Aggregate averages are misleading, because a high-performing utility asset can hide a bottleneck station that's falling apart.
NIST comparative survey work found the stronger preventive/predictive group recorded 52.7% less unplanned downtime and 78.5% fewer defects than the weaker group, with greater predictive emphasis associated with 18.5% less unplanned downtime and 87.3% fewer defects than greater preventive emphasis (NIST comparative survey). Those are benchmarks, not promises. They show the direction that disciplined maintenance can move when it's tied to actual performance.
Use three cadences, and don't mix them up. Weekly, review work-order discipline and open deviations. Monthly, review MTTR and MTBF by asset. Quarterly, review interval changes and condition-threshold adjustments. If a metric doesn't cause a decision, it's just wall art.
Segment by asset and failure mode
A plant can only improve what it can see clearly. That means every metric should be sliced by criticality tier and by failure mode. If one inspection station is driving most of the scrap, that problem shouldn't disappear into a plant-wide average. If a single packaging unit is behind most of the unplanned downtime, it needs a different response than the rest of the line.
The reporting platform matters less than the review discipline. Whether you use a CMMS, machine dashboards, or a simple controlled report, the point is the same. Connect the number to the asset, the failure mechanism, and the next maintenance interval. For plants that need software support, machine monitoring software can help when it's tied to a real decision workflow instead of just feeding more screens.
If you're serious about improvement, set one rule for the management team. No one gets to celebrate PM completion unless the unplanned downtime trend, defect trend, and repeat-failure trend are moving the right way. Activity is not the outcome. Availability, quality, and state of control are the outcome.
A 90-Day Rollout for Your First Stable Program
A weak program usually fails because it tries to do everything at once, or because it keeps talking about best practices while the shop floor stays uncontrolled. The better move is a hard 90-day rollout that builds discipline before optimization. That's how you get from reactive chaos to something the line can live with.
Days 1 to 30 build the base
Start with the asset register and criticality tiers. Then clean up your work-order coding so every failure, delay, and corrective action has a reason code that means something. If you can't classify the work, you can't improve it.
At the same time, define who owns each asset family. Maintenance, engineering, quality, and production should not all assume someone else is watching the same failure mode. This is also the point to remove duplicate asset names, missing spare-part links, and old equipment entries that still clutter the system.
Days 31 to 60 standardize the work
Write job plans for the Tier A assets first. Build in isolation steps, acceptance limits, required photos or readings, and sign-off fields that match the level of risk. Then review the spare-parts list and cut anything that doesn't trace to a failure, a lead-time risk, or a criticality decision.
Use this window to set the baseline for the metrics that matter. Planned-maintenance compliance, schedule compliance, downtime, MTTR, MTBF, defect rate, maintenance cost per operating hour, and repeat failures should all have a current starting point. Without a baseline, every later improvement is just a story.
Days 61 to 90 prove the model
Launch one condition-monitoring pilot on a single high-consequence failure mode. Keep the pilot narrow, with a defined alarm threshold, response owner, and escalation path. Then hold the weekly and monthly reviews without skipping them, even if the numbers are ugly.
If technicians bypass the new job plans, fix the work-order design and the supervision, not the techs. If leadership keeps rewarding activity instead of results, the scoreboard is wrong. If a sensor pilot creates alerts nobody can action, shut it down until the workflow exists.
Stable maintenance programs don't start with more tools. They start with clearer decisions, then add tools where the decisions are already disciplined.
That's the line to remember if you're running semi-automatic equipment, regulated production, or a plant that can't afford to guess. System Engineering & Automation supports manufacturers with practical engineering, semi-automatic systems, tooling, fixtures, controls, and maintenance support that keeps equipment performing after installation. If you want help tying maintenance discipline to production reality, visit System Engineering & Automation.