Buying a new machine is popular advice for improving production efficiency. It's also one of the fastest ways to spend capital on a problem you haven't defined. A faster CNC, cobot, feeder, or vision system won't rescue a process that loses time to unstable changeovers, missing materials, worn tooling, poor line balance, or defects at shift change.
A better approach starts with the losses hiding inside the process. Measure them, remove the waste that doesn't require new equipment, then automate only the constraint that remains. That sequence helps manufacturing operations managers, production engineers, and quality leaders improve throughput without sacrificing flexibility, validation control, or budget discipline.
Table of Contents
- The Hidden Problem Behind Low OEE
- Set a Baseline You Can Defend
- Lean Moves to Pull Before You Spend Capital
- Choosing the Right Level of Automation
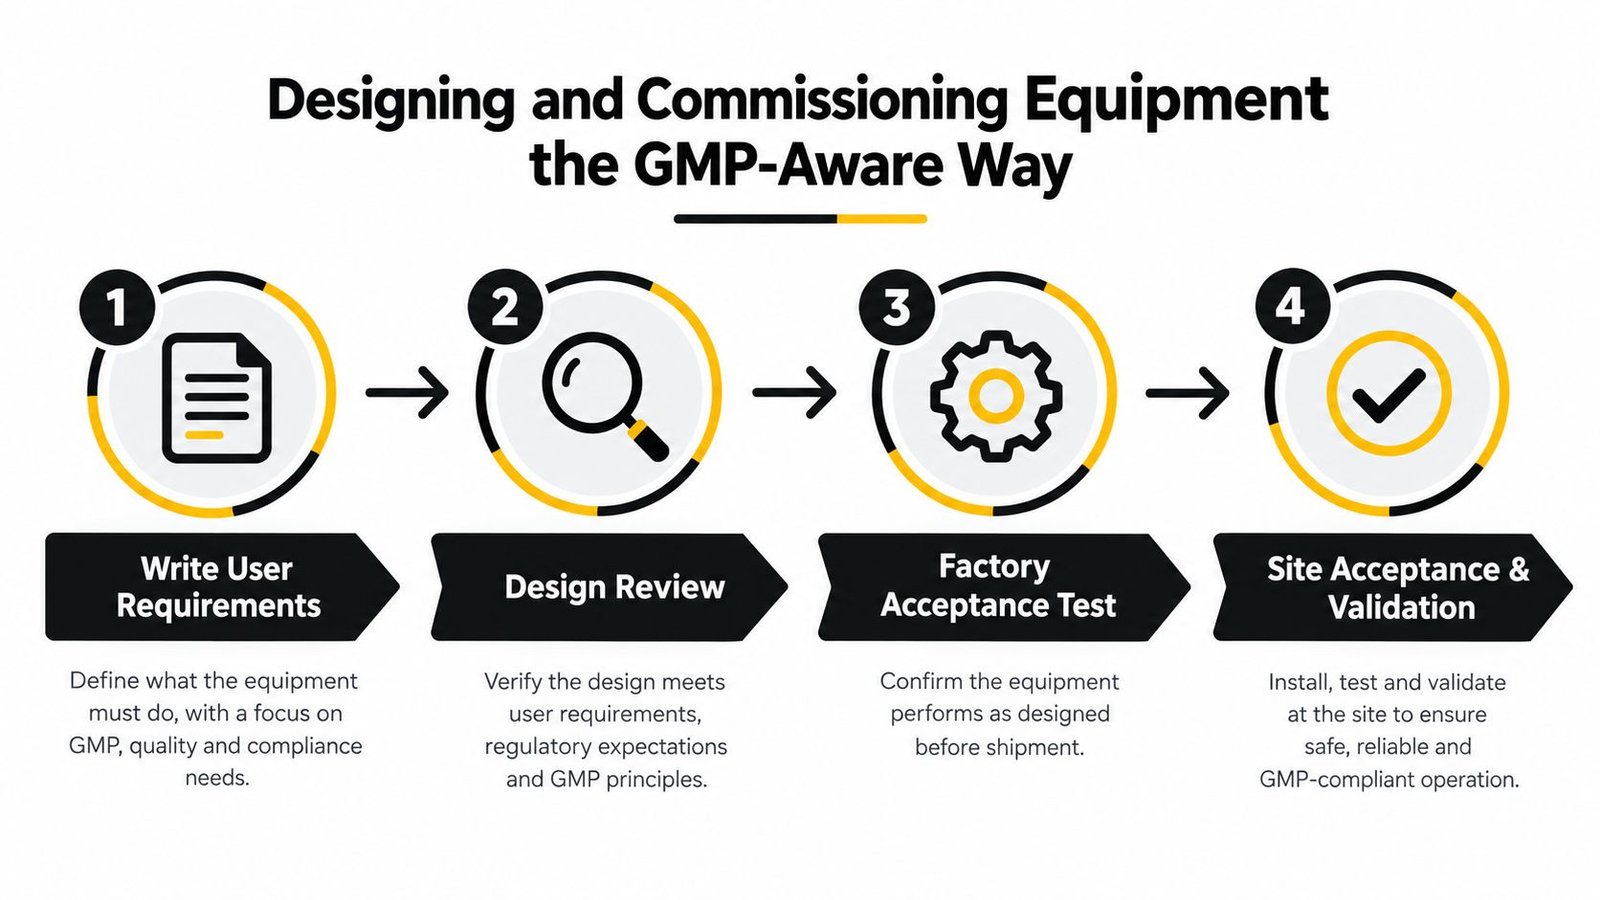
- Designing and Commissioning Equipment the GMP-Aware Way
- Measuring ROI and Sustaining the Gains
- A Practical 90-Day Plan for Your Plant
The Hidden Problem Behind Low OEE
A fast machine can still produce weak results. Production efficiency depends on availability, performance, and quality together, not rated speed alone. OEE equals Availability × Performance × Quality, measuring how much planned production time creates usable output, as explained in this OEE calculation guide.
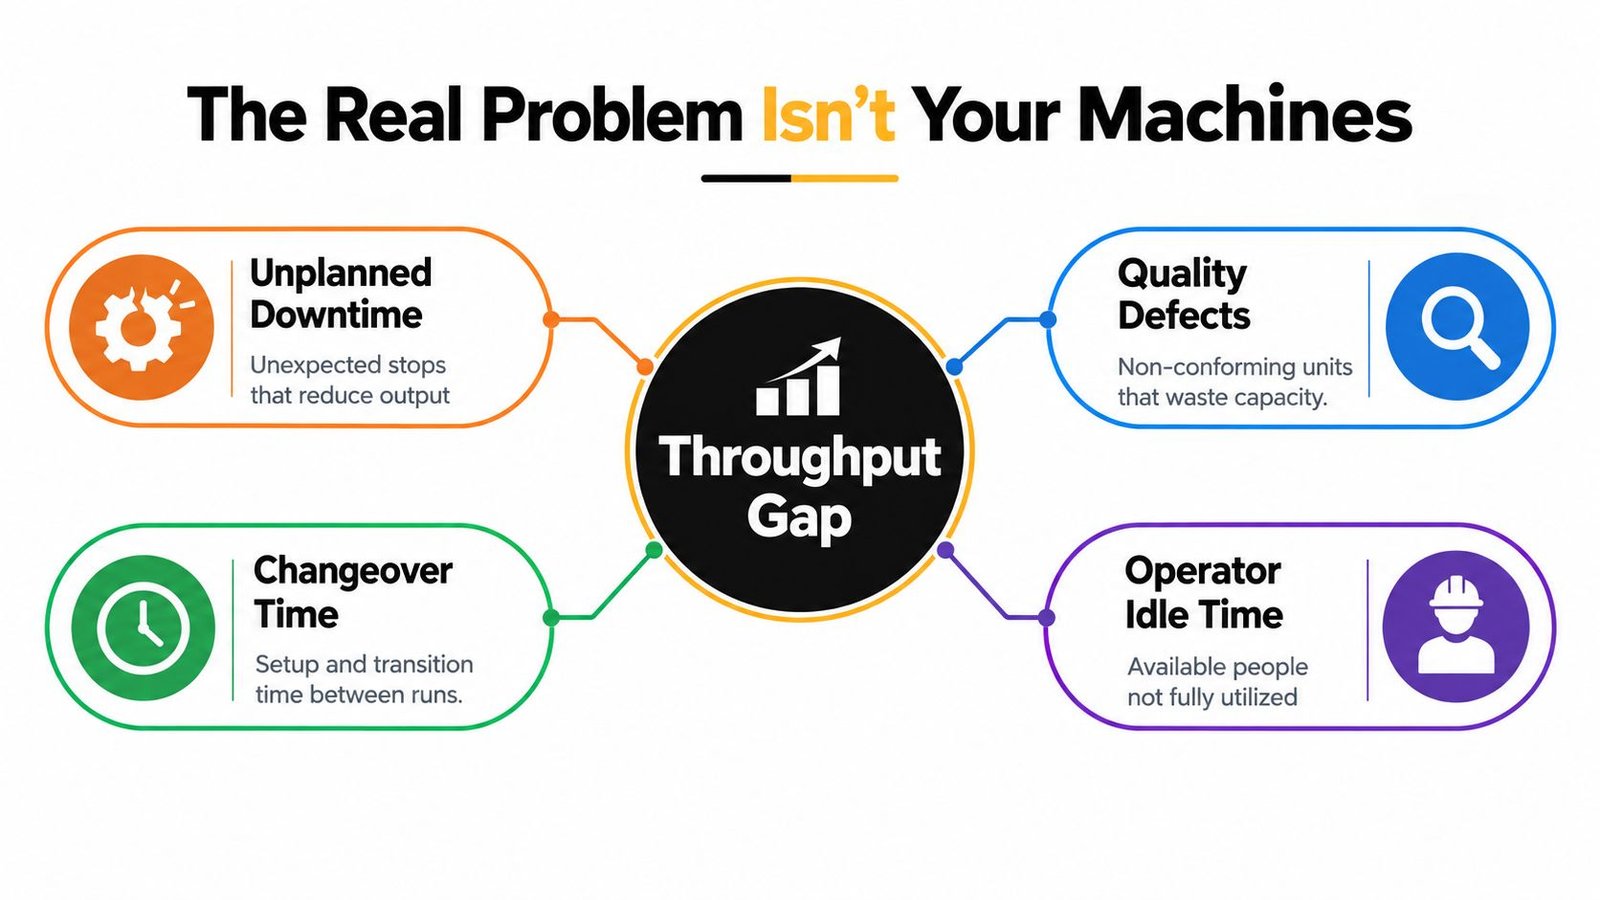
The largest losses often sit between headline metrics. A feeder may stop repeatedly for seconds at a time. Operators may wait for material, search for tooling, or intervene in sequences that ignore actual work. Worn tooling creates downtime, while startup scrap and ramp-up defects cancel the benefit of a faster nominal cycle.
Symptoms of a process problem
Check these signals before approving a machine replacement:
- Shift-to-shift variation: One crew repeatedly delivers different output or quality from another.
- Frequent operator intervention: The line needs constant resets, hand-feeding, inspection, or adjustment.
- Shift-change scrap clusters: Defects emerge during handoffs because instructions, settings, or material status are not controlled.
- Work-in-Process accumulation: Excess material between stations shows uneven flow. Adding speed everywhere will not correct it.
The benchmark gap also matters. Independent 2026 manufacturing benchmarks place median OEE near 60%, the top quartile near 75%, and world-class performance at about 85% under the ISO 22400-2 benchmark. A separate 2025 industry dataset reported 66.8% OEE for discrete manufacturing, while only a small minority of plants consistently reached 85% or higher, according to the 2026 manufacturing OEE benchmark report.
Automation should follow the loss analysis, not replace it. First identify whether the constraint is downtime, material readiness, operator intervention, or process variation. Then remove the losses that do not require new equipment and reserve automation for the remaining constraint.
Practical rule: Do not select equipment until you can name the loss it must remove, the data proving that loss exists, and the operating condition that will confirm the fix worked.
Ask, “Which loss limits good output, and what is the least expensive reliable way to remove it?” That answer should determine whether you need a machine, a process change, or better control.
Set a Baseline You Can Defend
A single OEE number on a presentation slide is not a defensible baseline. The team must trace it to shift records, downtime events, production counts, and quality results before using it to approve improvement work.
Calculate the three components consistently:
- Availability = Run Time ÷ Planned Production Time
- Performance = Ideal Cycle Time × Total Pieces ÷ Run Time
- Quality = Good Pieces ÷ Total Pieces
Multiply the three results to calculate OEE. Apply the same definitions across lines and shifts. Otherwise, reviews become disputes over measurement instead of decisions about lost output.
Break the loss into actionable categories
Split lost productive time into six categories. Use this table as the starting structure for a weekly review.
| Loss Category | Definition | Data Source | Hours Lost/Month |
|---|---|---|---|
| Availability losses | Equipment is stopped during planned production time | Downtime log and machine status | |
| Performance losses | Equipment runs below its ideal cycle rate | Production counter and cycle-time record | |
| Setup and changeover losses | Planned time consumed by product or tooling changes | Changeover log and time study | |
| Minor stops and reduced speed | Short interruptions or sustained slow running | Operator reason codes and controller data | |
| Defects and rework | Output requiring rejection, repair, or additional processing | Quality records and rework tickets | |
| Start-up and yield losses | Losses during ramp-up before stable acceptable production | First-piece and startup inspection data |
Give operators a short, clear reason-code list for every event. Keep “Other” temporary. If it becomes the dominant category, the data cannot distinguish a maintenance problem from poor material staging, an unsuitable fixture, an unclear work instruction, or a control-sequence issue.
Use benchmark differences as a prioritization signal, not as a target copied onto every line. The gap between typical, upper-quartile, and world-class performance points managers toward changeovers, minor stops, speed losses, and quality losses. As noted earlier, the manufacturing OEE benchmark analysis provides context for those comparisons.
Produce three management artifacts
Publish a weekly OEE trend by line and shift. Pair it with a Pareto chart ranking loss categories by hours lost per month. Then write a top-three constraint list that operations and finance both approve. Finance must confirm that each loss has economic weight. Operations must confirm that the proposed countermeasure can work on the floor.
Use historical productivity evidence to support sustained improvement rather than chase a universal target. The U.S. Bureau of Labor Statistics reports that manufacturing labor productivity grew at an average annual rate of 2.1% from the first quarter of 1987 through the third quarter of 2025, while productivity increased 3.3% from the first quarter to the third quarter of 2025 in the current cycle, as reported in this BLS manufacturing productivity analysis.
The management decision is straightforward: establish the number your plant can defend, identify the losses behind it, and assign an owner to each countermeasure. Hold automation until the baseline shows which remaining loss requires equipment rather than tighter execution or process control.
Lean Moves to Pull Before You Spend Capital
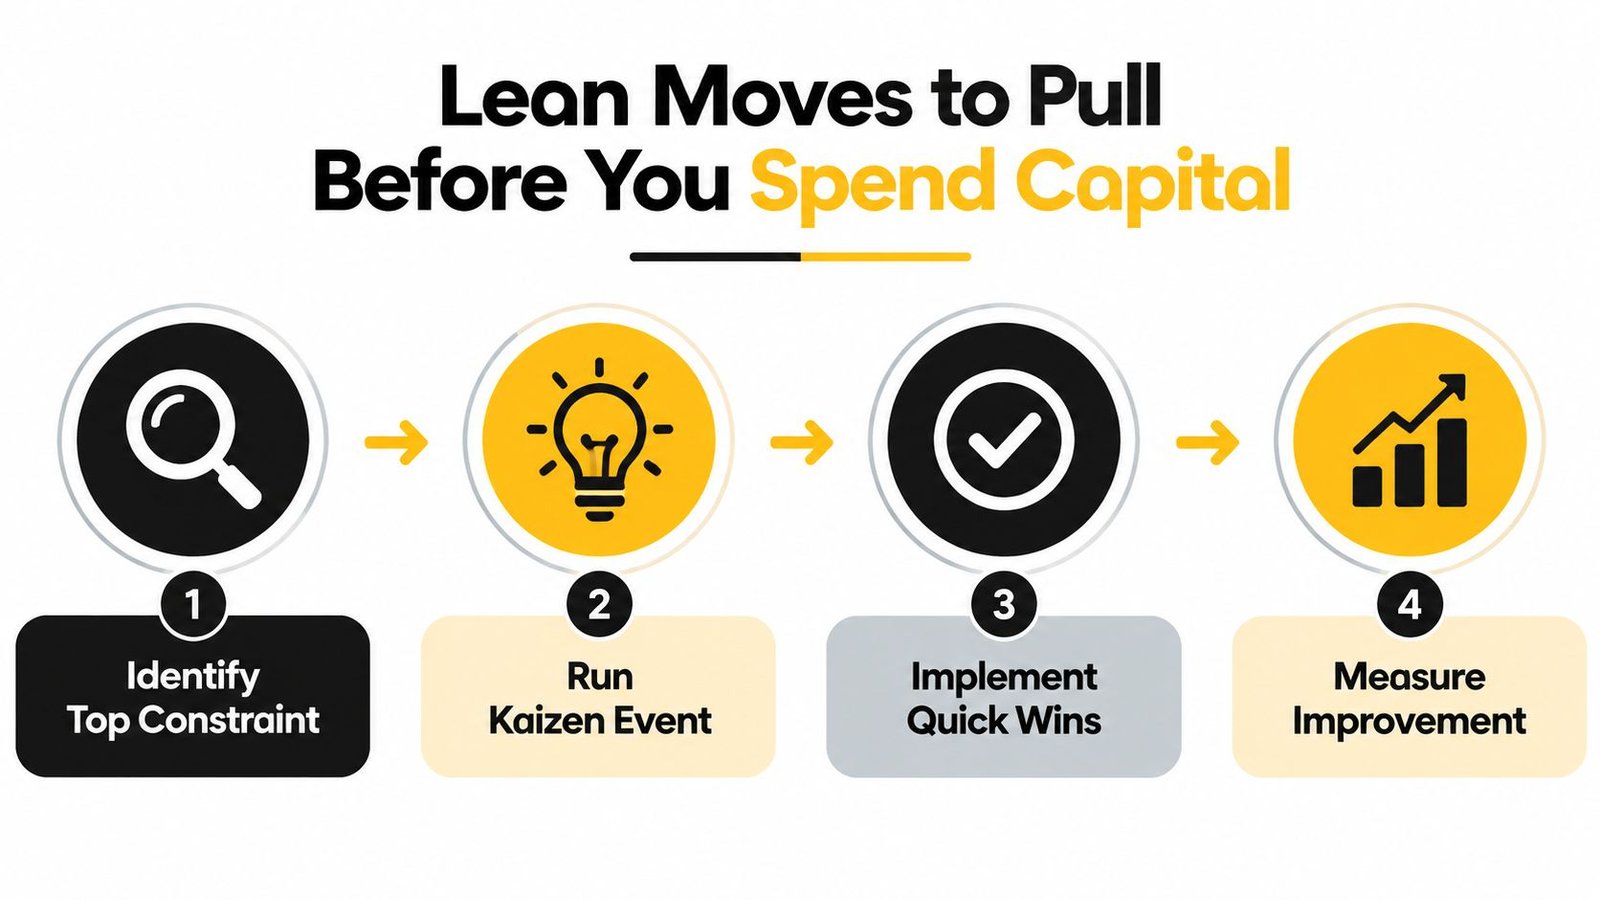
Lean improvement should consume the first budget before an automation RFQ goes out. Run a focused Kaizen event on the top constraint, make the process repeatable, and then ask equipment suppliers to solve the remaining problem rather than the entire operation.
Begin with SMED, or Single-Minute Exchange of Dies. Separate internal setup tasks, which require the machine to be stopped, from external tasks that can happen while it runs. Move preparation, tooling checks, material staging, and documentation outside the downtime window. Standardize the remaining motions, add preset tooling or fixtures where appropriate, and validate the new sequence with a time study.
One industrial case reduced setup time from 80.91 minutes to 65.36 minutes, a 19.22% reduction, by applying SMED-based process redesign, as documented in this industrial engineering changeover study. Published SMED studies report setup-time reductions ranging from 25% to 85% when the method is fully implemented. Treat those figures as evidence of the method's potential, not as a promise for your line.
Fix motion and flow at the workstation
A time study often exposes capacity that a new machine would hide. Use a Man-Machine Chart to identify waiting, a Left-Right Hand Chart to remove awkward motion, and ECRS principles to eliminate, combine, rearrange, or simplify work. Then redesign the station before adding automation.
One production-line case cut cycle time from 33.61 seconds to 25.88 seconds, increased daily output from 214 boxes to 278 boxes, raised line-balancing efficiency from 44.57% to 83.85%, and reduced staffing by three operators, according to this production-line balancing study. The important result wasn't labor reduction by itself. It was better flow created through motion simplification, tooling, and task rebalancing.
Use practical countermeasures:
- Fixtures and jigs: Control part orientation, eliminate hand-feeding variation, and make correct loading easier.
- Heijunka-style leveling: Smooth the production sequence so the line isn't forced into constant schedule changes.
- 5S changeover control: Keep tooling, carts, gauges, and instructions at the point of use.
- Poka-yoke: Prevent the most common defect at the station where it originates.
- Standardized work: Use clear instructions, photos, settings, and inspection points at manual stations.
Broader lean implementation reports cite setup-time improvements of 30% to 50% when internal and external setup work is optimized and 5S discipline is enforced, as summarized in this OEE benchmark discussion. Use the result as a reason to measure first, not as a guaranteed return.
For a structured approach to these methods, review lean manufacturing process improvement.
Choosing the Right Level of Automation
Automation should match the constraint, product mix, and risk profile. A vendor demo can make full automation look inevitable. On a real plant floor, manual, semi-automated, and fully automated systems each win under different conditions.
| Criterion | Manual | Semi-Automated | Fully Automated |
|---|---|---|---|
| Product mix | Low volume and high mix | Repetitive task within a varied process | Stable product family and repeatable sequence |
| Best use | Human judgment and flexible handling | A defined bottleneck or repetitive micro-task | Long, predictable production runs |
| Changeover | Fast adaptation by trained operators | Tooling or recipe changes require controlled setup | Changeover must be engineered and validated |
| Quality conditions | Operator inspection remains important | Controls assist the operator and catch errors | Process capability and inspection logic must be stable |
| Labor situation | Labor is available and skilled | Labor is constrained at one operation | Labor dependency is a major cost or availability risk |
| Footprint | Minimal equipment area | Targeted cell or retrofit | Dedicated integrated line |
| Validation burden | Lower equipment complexity | Moderate controls and documentation | High integration, software, and validation demand |
| Suitable investment logic | Preserve flexibility | Remove a specific loss | Support a defensible long-term volume forecast |
Manual is often the right answer
Choose manual operation when volumes are low, SKU variability is high, and changeovers dominate the schedule. A well-designed manual station with a fixture, visual controls, and standardized work can outperform a poorly specified automated cell because it adapts faster and creates less validation burden.
Semi-automation is the practical middle
Semi-automation fits when one repetitive micro-task is slowing the line but the rest of the process still needs human judgment. Examples include custom tooling, part-present sensors, guided assembly, bowl feeders, controlled dispensing, ergonomic lift assists, and retrofit conveyors. This approach can remove manual handling at the problem station without forcing the entire line into a rigid architecture.
Don't assume the constraint itself must be automated first. If the bottleneck is frequently starved by upstream material preparation, stabilize that upstream step. If downstream inspection interrupts the constraint, improve inspection flow so the bottleneck can run undisturbed.
Full automation needs stable conditions
Full automation makes sense when cycle times are stable, quality is predictable, the product forecast is defensible for five or more years, and the plant can support controls, maintenance, spare parts, training, and validation. The levels of automation guide provides a useful framework for comparing these choices.
Industrial manufacturers are moving toward more automation. A 2026 industrial manufacturing outlook reported that the median share of manufacturers expecting highly automated processes would rise from 18% to 50%, a projection described in PwC's industrial manufacturing outlook. That direction matters, but it doesn't override the need to select the right level for your plant.
Designing and Commissioning Equipment the GMP-Aware Way
For medical-device, pharmaceutical, and other regulated operations, equipment design is a documentation problem as much as a mechanical one. A cell that produces quickly but lacks traceable requirements, controlled software, or approved change records can create a quality problem instead of a production solution.
Start with a User Requirements Specification, or URS. Tie every requirement to the loss you intend to remove. “Reduce manual inspection” is incomplete. Specify the process condition, the quality risk, the operator interaction, the data requirement, and the acceptance method. Don't copy a vendor feature list into the URS and call it engineering.
Freeze the design before procurement
Flow the URS into a Functional Specification, then a Design Specification. The FS should explain what the system must do. The DS should define how the equipment, controls, tooling, sensors, guarding, materials, and software will do it.
Review and freeze each document before procurement. Scope changes introduced after purchasing can increase cost by 30%, according to the planning guidance provided for this equipment-design approach. Treat that figure as a warning about uncontrolled scope, not as a universal project surcharge.
Commission in three qualification stages
Use a staged commissioning plan:
- Installation Qualification, or IQ: Confirm that the machine, utilities, materials, drawings, components, and documentation match the approved Design Specification.
- Operational Qualification, or OQ: Confirm that controls and functions operate across the defined operating range, including alarms, interlocks, recipes, and safe-state behavior.
- Performance Qualification, or PQ: Confirm that the equipment produces acceptable product under real production conditions with trained personnel and approved materials.
For medical-device or pharmaceutical lines, add an FMEA-based risk assessment, software validation aligned with GAMP 5, and formal change control. Quality Assurance should review and sign the change record before production orders run on the modified line.
A Factory Acceptance Test should test the functions that matter before shipment. Site Acceptance should confirm that installation, utilities, integration, training, and operating procedures work in the actual plant. The faster path is controlled execution, not skipping documentation and discovering gaps during release.
Measuring ROI and Sustaining the Gains
An automation project doesn't create value because it reduces labor at one station. It creates value when the plant produces more acceptable output, avoids waste, reduces downtime, and carries the full cost of ownership transparently.
Use this ROI structure:
ROI = (annual labor savings + scrap savings + downtime savings + throughput lift) minus (equipment cost + installation + validation + annual maintenance + floor space), divided by the same total-cost denominator.
Keep every assumption visible. Separate actual savings from theoretical capacity. A throughput lift only has value if the plant can sell, schedule, staff, inspect, and ship the additional good output.
Stress-test the business case
Build best-case, expected-case, and worst-case scenarios. Change the assumptions for uptime, quality, labor availability, maintenance demand, product mix, and ramp-up time. Include validation effort for regulated lines and floor space for equipment that displaces another production activity.
The automation ROI calculator can help organize the inputs, but no calculator can repair weak baseline data. Use the loss records from the earlier diagnostic, then have operations, finance, maintenance, and quality challenge the assumptions separately.
Make the improvement part of daily work
A gain will drift if the plant treats commissioning as the finish line. Establish an operating rhythm with clear ownership:
- Daily tier-one huddle: Review OEE, downtime events, quality issues, and actions at the line.
- Weekly loss review: Revisit the top three losses and close overdue countermeasures.
- Monthly maintenance walk: Have operators and reliability technicians inspect the equipment together.
- Quarterly Kaizen funnel: Rank new ideas by constraint impact, feasibility, risk, and required investment.
The common pattern described in the planning guidance is a 10% to 15% initial gain decaying to 3% to 5% within a year when the operating rhythm is absent. Those figures reinforce a practical point: sustaining the process is part of the project scope, not an optional improvement activity.
A 2026 manufacturing AI and automation outlook found that seven in ten manufacturers had automated 50% or less of their core operations, indicating that most plants still have room to expand beyond partial adoption, as reported in the Redwood manufacturing automation outlook. Expand only after the first automated improvement is stable and its economics are proven.
A Practical 90-Day Plan for Your Plant
A plant manager can launch this program on Monday without waiting for a complete digital transformation. The sequence below keeps diagnosis ahead of procurement and forces every capital request to compete with lower-cost process improvements.
Days 1 through 15 establish the facts
Instrument OEE on the selected line using real shift data. Capture availability, performance, quality, changeovers, minor stops, reduced speed, defects, rework, startup losses, and material-related interruptions. Rank constraints by impact and fixability, then publish the weekly trend, the loss Pareto, and the signed top-three list.
Don't start with the most visible machine. Start with the constraint that repeatedly limits good output.
Days 16 through 45 run the lean sprint
Run SMED on the worst changeover. Separate internal and external tasks, prepare tooling offline, standardize the changeover kit, and re-measure until operators can repeat the sequence. Use time-and-motion observation to rebalance the bottleneck line, then stabilize the result with 5S, visual controls, fixtures, and standardized work.
If the loss disappears after these changes, cancel the machine purchase. That isn't failure. It's capital discipline.
Days 46 through 75 select the automation level
Score the remaining constraint against product mix, part life expectancy, labor availability, footprint, validation burden, maintenance capability, and payback horizon. Compare manual, semi-automated, and fully automated options. Request vendor quotes only for the shortlisted cell, not for every possible improvement.
For regulated operations, lock the URS with operations, quality, and finance before design work proceeds. For non-GMP operations, use the same discipline even when formal qualification isn't required.
Days 76 through 90 prepare validation and scale-up
Finalize the FAT and SAT plan. Assign owners for IQ, OQ, and PQ where qualification applies. Run a small ROI pilot on a non-GMP line before scaling a concept into a validated process, then document the assumptions and actual results.
Manufacturing capacity utilization in the United States was 76.0% in July 2026, which was 2.2 percentage points below its long-run average, according to the Federal Reserve industrial production and capacity utilization release. That supports a selective approach. Improve execution, scheduling, maintenance, and flow before assuming the plant needs more equipment.
Continue with a weekly OEE review, a monthly continuous-improvement stand-up, and a quarterly constraint refresh. The objective isn't a perfect plan. It's a defensible sequence that converts hidden losses into measurable actions and makes every capital decision earn its place.
System Engineering & Automation provides manual, semi-automatic, and fully automated equipment, along with custom tooling, fixtures, controls, installation, commissioning, and GMP-aware engineering support. If your plant needs to remove a specific bottleneck without overspending, visit System Engineering & Automation to discuss the constraint, baseline data, and practical equipment path.