More data won't automatically produce better manufacturing decisions. A plant can collect PLC states, SCADA alarms, inspection results, and maintenance histories yet still send technicians to the floor with little more than a dashboard and a vague alert. The useful question isn't how much data your operation stores. It's whether the right person can act on a trusted signal before downtime, scrap, or a quality escape becomes expensive.
That distinction matters for small and mid-sized manufacturers, especially on semi-automated lines where automated equipment, manual workstations, legacy controls, and operator judgment all coexist. Manufacturing data analytics creates value when it connects machine signals to work orders, quality checks, scheduling decisions, and line-level routines. It becomes another reporting project when it stops at visualization.
The market's growth reflects that shift. Mordor Intelligence estimates the manufacturing industry's big data analytics market at USD 7.30 billion in 2025, with a projection of USD 14.30 billion by 2030 and a 14.40% CAGR (Mordor Intelligence's manufacturing analytics market analysis). Investment is rising, but practical returns still depend on disciplined implementation.
Table of Contents
- Why Most Manufacturing Analytics Projects Stall at Dashboards
- Core Components of a Manufacturing Analytics Stack
- Data Sources and KPIs That Drive Real Production Value
- Implementation Roadmap for Semi-Automated Production Lines
- Practical Use Cases From the Production Floor
- GMP Compliance and Data Governance for Regulated Manufacturing
- Common Pitfalls and Best Practices for Sustainable Analytics
Why Most Manufacturing Analytics Projects Stall at Dashboards
The popular advice is to centralize everything, apply advanced AI, and give every stakeholder a real-time dashboard. That sequence sounds modern, but it often fails on the shop floor. Operators don't need another screen that tells them a machine stopped. They need a clear reason, a responsible action, and a workflow that records what happened next.
Manufacturing analytics had already moved beyond isolated experimentation by the early 2020s. LNS Research reported that 33% of manufacturers had fully implemented Advanced Industrial Analytics beyond pilots, while 19% were still in pilot stages and 8% had implementation budgeted within one year (Epicor's summary of industrial analytics findings). Yet a separate 2021 study of more than 1,300 manufacturing executives found that only 39% had scaled data-driven use cases beyond one product line while achieving a clearly positive business case, according to the same reference.
Adoption isn't the same as operational impact
A dashboard can aggregate data without changing a decision. A predictive maintenance model can identify a failure precursor without reserving a maintenance window, checking spare-parts availability, or generating a work order. A quality model can flag process drift without giving the operator an approved adjustment range.
That gap is why analytics should be treated as an operational discipline, not a software purchase. The system must define who receives an alert, what evidence supports it, what action is permitted, and how the response is captured. Without those decisions, advanced analytics only accelerates the delivery of information nobody owns.
Practical rule: Every metric needs a named owner and a defined response. If no one can explain what changes after an alert, the metric isn't ready for production use.
Narrow use cases usually beat broad rollouts
Smaller manufacturers often get better traction by choosing one constrained problem, such as recurring downtime on a critical press, unexplained scrap at a manual inspection station, or energy waste during changeovers. The relevant data is easier to validate, the workflow is visible, and the business case can be tested without rebuilding the plant's entire information architecture.
This approach aligns with the adoption gap identified in industry reporting on manufacturing analytics statistics, which notes that many organizations still struggle to monetize business intelligence and AI. The lesson isn't that platforms lack value. It's that insight without execution has limited commercial value.
Core Components of a Manufacturing Analytics Stack
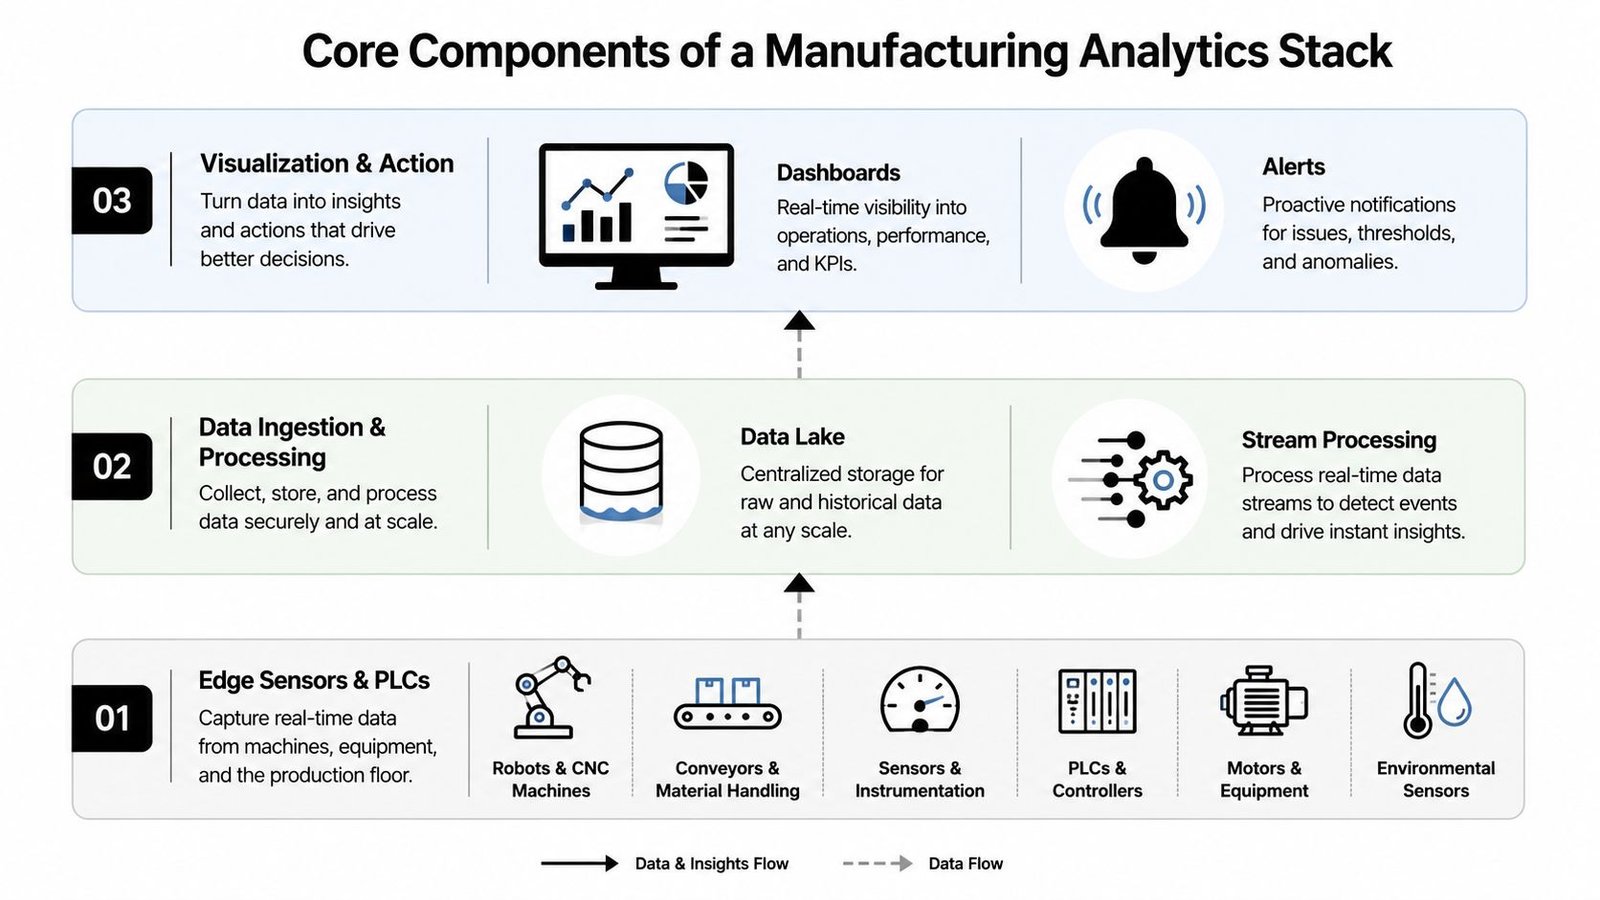
A practical stack has three jobs. It must capture reliable signals, turn those signals into usable context, and deliver a decision where production staff can act. The technology can be cloud-based, local, or hybrid, but the flow should remain understandable from the sensor to the response.
Start at the edge
The first layer includes sensors, PLCs, robots, drives, and machine controllers. A PLC may expose cycle-complete states, permissives, fault codes, recipe values, and counters. Added condition sensors can contribute vibration, temperature, motor current, pressure, or air-flow readings.
On semi-automated equipment, the edge layer also needs to represent human activity. A foot pedal, fixture clamp, barcode scan, manual pass-fail entry, or operator reset may determine whether a cycle is complete. Ignoring those events creates misleading cycle times and makes the model look more certain than the process really is.
Move data through an ingestion layer
Data ingestion connects OT systems to the analytics environment. Common patterns include OPC UA gateways, industrial protocols, historian exports, database connectors, and edge computers that normalize tags before forwarding them. The choice matters because raw PLC tags rarely carry enough context on their own.
A tag called Motor_Run doesn't explain which asset, product, recipe, shift, or work order was active. The processing layer should associate events with equipment identity, timestamps, production state, part number, and reason codes. It should also handle missing values, duplicated events, clock differences, and sensor calibration changes.
Make visualization serve action
Dashboards belong at the top of the stack, but they're not the destination. A supervisor may need a trend view, while an operator needs a simple alarm with context. A maintenance planner may need a prioritized work queue, and a quality engineer may need a traceable link between a defect and the process conditions that preceded it.
The architecture should therefore support alerts, workflow triggers, and system integrations, not only charts. A data lake is useful for historical analysis, stream processing supports near-real-time decisions, and visualization provides human access. The stack becomes operational when those pieces connect to MES, ERP, computerized maintenance management systems, and approved line procedures.
Data Sources and KPIs That Drive Real Production Value
Manufacturers don't need every available signal to begin. They need data that explains a costly event and arrives in a form people can trust. Start with the smallest set that can connect a production loss to a decision.
PLC data is often the best foundation because it already records machine states, cycle transitions, interlocks, counters, and faults. SCADA alarm logs add operating context, while quality records reveal whether process conditions produced acceptable parts. Maintenance work orders complete the loop by showing what technicians found and what they changed.
Condition-monitoring signals are valuable when they relate to a known failure mode. Vibration, temperature, current draw, and cycle counts can support predictive maintenance when combined with historical maintenance records and machine-learning models (SR Analytics on predictive analytics in manufacturing). Manual inspection results shouldn't sit in a spreadsheet disconnected from the line. Capture them with an operator interface, barcode workflow, or controlled form that preserves the part, station, timestamp, and reason for rejection.
Choose KPIs that trigger decisions
The most useful starting measures include mean time between failures, mean time to repair, unplanned-downtime share, and first-pass yield. Scrap rate, changeover duration, cycle-time variation, and quality escapes may also matter, depending on the process. Don't put every metric on the first screen. Select measures that correspond to a problem the team has agreed to address.
| Data Source | Primary KPIs | Typical Improvement Range |
|---|---|---|
| PLC states and cycle counters | Cycle time, throughput, unplanned downtime share | Qualitative improvement depends on the baseline and action taken |
| Vibration, temperature, current, and cycle counts | MTBF, failure alerts, maintenance response | About 30% to 50% lower unplanned downtime and 10% to 40% lower maintenance costs are commonly reported when predictive maintenance is properly connected to execution (SR Analytics) |
| SCADA alarms and fault history | Alarm recurrence, MTTR, stoppage causes | Earlier diagnosis and more consistent response |
| Inspection and test records | First-pass yield, defect rate, scrap trends | Published case material reports roughly 10% first-pass-yield improvement when analytics is integrated into production workflows (Factored manufacturing downtime case material) |
| Maintenance work orders | MTTR, repeat failures, spare-parts usage | Better planned interventions and maintenance prioritization |
For teams evaluating machine monitoring software, the key selection question is whether the system can preserve event context and route findings into daily work. A clean availability chart is useful. A chart that automatically identifies the responsible asset, opens a maintenance task, and records the response is much closer to production value.
Implementation Roadmap for Semi-Automated Production Lines
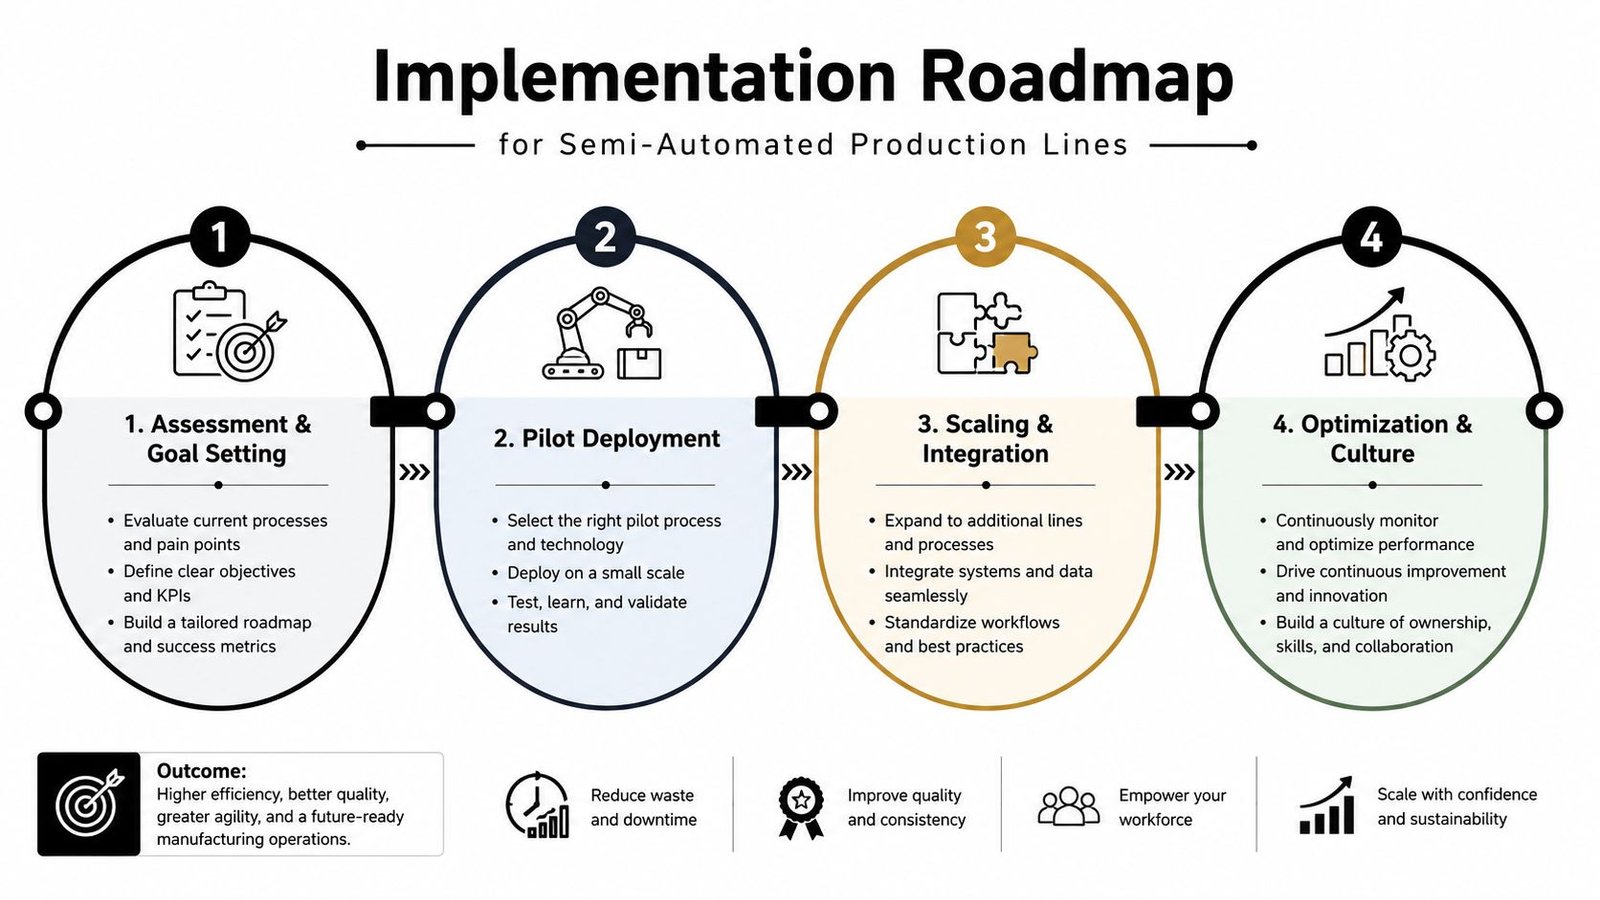
A semi-automated line can produce useful analytics without replacing the equipment already earning revenue. Start with a contained operational problem, preserve traceability, and connect each finding to a person or system that can act on it.
Start with assessment and goal setting
Map the line before selecting a platform. Record PLC brands and generations, SCADA servers, historians, network boundaries, manual stations, inspection points, maintenance systems, and the signals operators already trust. Check where timestamps originate, then verify whether PLC, SCADA, and business-system clocks agree. Misaligned time can invalidate an otherwise accurate event sequence.
Define one business problem with a measurable operational definition. “Improve efficiency” is too broad. “Classify recurring stops on the filling station and route confirmed mechanical faults to maintenance” gives engineering and operations a testable target.
Pilot one line or asset group
Extract existing data before adding hardware. A legacy PLC may expose enough state information through an available gateway. Older equipment may need discrete I/O, a protocol converter, or retrofit sensors. Add instrumentation only when it closes a specific information gap, especially where GMP records require a defensible connection between an event and its batch or work order.
Keep the first alerts advisory. Let operators and technicians compare predictions with actual conditions, record false alarms, and tune thresholds before automatic action. Published case material reports precision around 0.90 and recall around 0.60 to 0.85 for downtime prediction models, illustrating why validation matters before a model can influence a line decision.
Scale through integration
Once the signal is trusted, connect it to the workflow. A confirmed equipment risk should reach the CMMS or maintenance queue. A quality deviation should associate with the affected batch or work order. A scheduling constraint should be visible to the planner rather than buried in an analytics portal.
Integration is usually harder than model selection. PLC states, SCADA alarms, MES records, ERP transactions, and quality data often use different identifiers and event conventions. An integrator familiar with both controls and business systems can help define those mappings and support process improvement and automation where manual work and legacy controls make a standard template impractical.
Optimize the operating routine
The final phase is operational ownership. Review alerts in daily production meetings, assign responsibility, update procedures, and remove signals that produce no useful action. Record who accepted, rejected, or escalated each alert, particularly in regulated environments where traceability matters.
Analytics belongs in maintenance planning, quality review, and scheduling. It should not remain a separate digital initiative dependent on one enthusiastic engineer. A small line can scale successfully when its data definitions, response steps, and audit trail are established before additional assets are connected.
Practical Use Cases From the Production Floor
A useful production example starts with a stoppage, not a model. On a semi-automated assembly line, one fault code may mask a gradual change in motor current, cycle duration, or fixture behavior. The practical job is to combine those signals with maintenance history, confirm the pattern, and give the team enough lead time to intervene during a planned stop.
Predictive maintenance creates value only when an alert reaches execution. Sensor streams from vibration, temperature, current draw, and cycle counts, paired with maintenance records, can expose failure precursors before a breakdown (SR Analytics' practical explanation of predictive maintenance analytics). The output should identify the asset, assign a severity level, recommend an inspection, and connect to a work-order path maintenance can complete. “Failure probability is high” is not an actionable instruction.
Prevent defects before final inspection
Quality analytics follows the same operational principle. Link process parameters, recipe values, machine states, operator entries, and inspection outcomes to one part or batch identity. When defects cluster after temperature drift, a fixture change, tool replacement, or an extended cycle, the system can flag the condition before another group of parts reaches final inspection.
Operators remain part of the control loop. A model may detect an unusual combination of conditions, while the operator recognizes material problems, fixture contamination, or a setup change missing from the data. Design the response around confirmation and controlled intervention. In GMP-regulated production, that human decision and its traceability matter as much as the alert.
Find throughput losses hidden in averages
Average cycle time can conceal the bottleneck. A line may appear healthy while one station loses time to repeated resets, manual replenishment, inspection waits, or short stops that never receive a formal downtime code. Combine PLC events with SCADA alarms, operator reason codes, and work-order context to separate equipment loss from material, staffing, and process losses.
Analytics should also expose the handoff required at the line. A short-stop pattern is useful only if the shift lead can verify it, maintenance can address the cause, and production planning can account for the lost capacity. Small and mid-sized manufacturers often gain more from a clear response path than from a more advanced algorithm.
A production alert earns trust when it helps an operator make the next correct move.
Start with recommendations floor staff can verify. Show the triggering signals, specify the response, and record whether the action worked. That feedback improves the model and gives supervisors evidence that the analytics supports production rather than creating another dashboard to monitor.
GMP Compliance and Data Governance for Regulated Manufacturing
In regulated manufacturing, a strong historical model does not make an analytics result trustworthy by itself. Quality teams need to trace the data source, identify who changed it, confirm the model version, and reconstruct the response later.
Medical device manufacturers already use structured quality measures. MDIC guidance identifies time, production yields, non-conformance rates, scrap trends, process and design validation results, design review, and post-market complaint incidence per million as important metrics in a regulated environment (MDIC medical device quality metrics guidance). Analytics should strengthen that quality system. A separate record with unclear authority creates another reconciliation problem.
Build lineage into the architecture
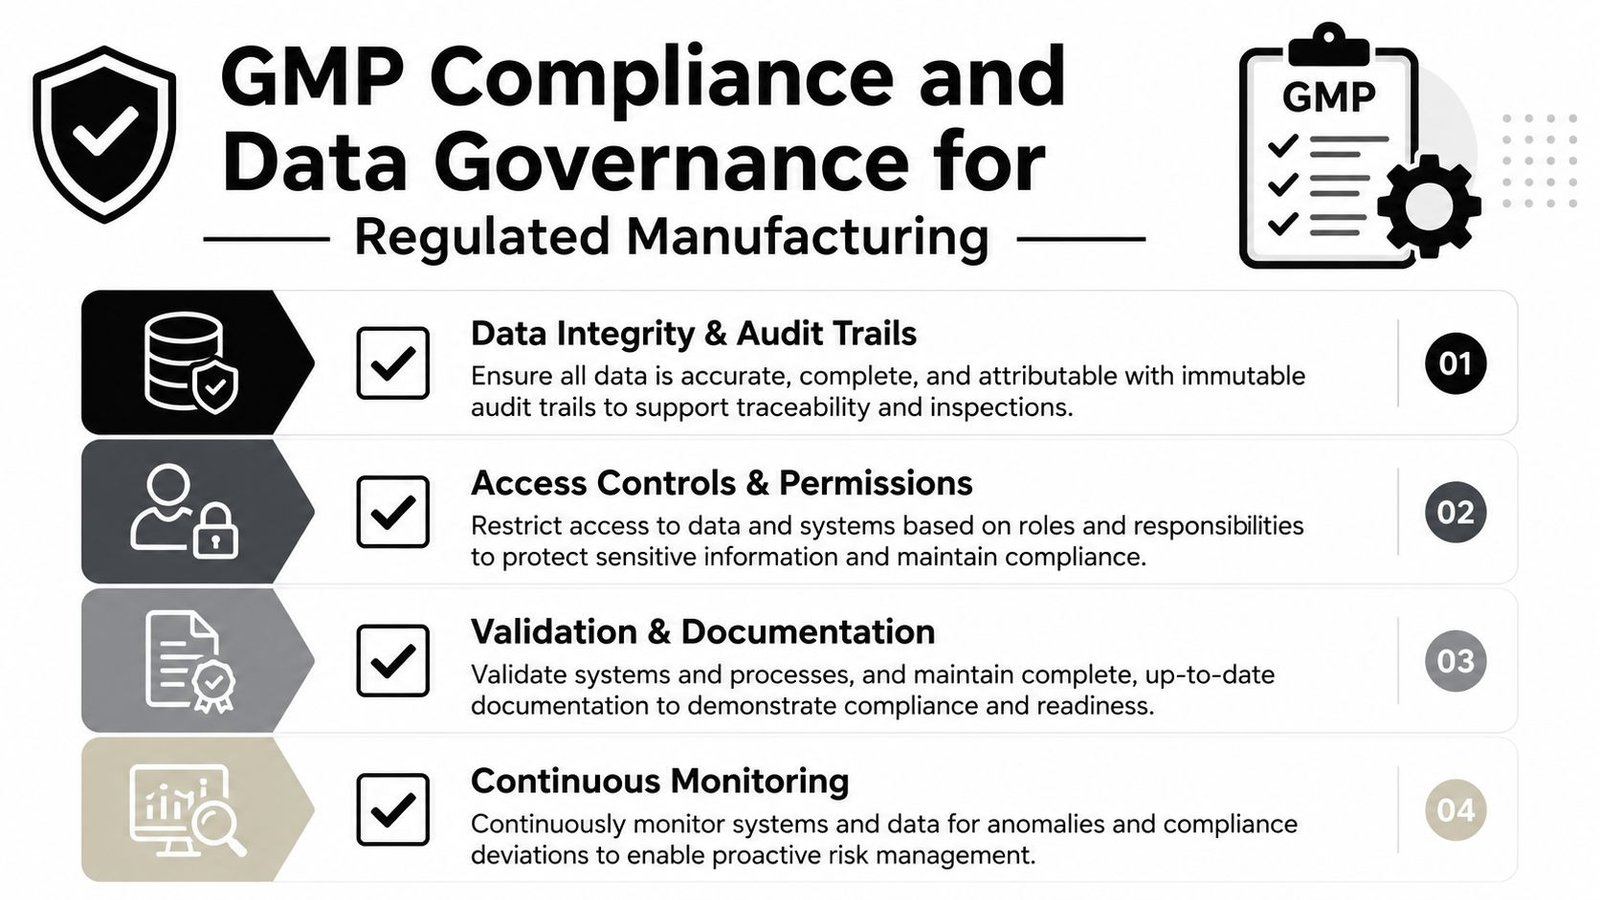
Give every significant data point enough context for traceability. Record asset identity, source system, timestamp, recipe or product state, user or system action, and each transformation applied before analysis. If a sensor value is corrected, filtered, or excluded, preserve the decision and its reason.
Access controls should match responsibility. Operators can acknowledge an alert, engineers can adjust approved thresholds, and quality personnel can review deviations. Model changes, configuration updates, and data corrections require controlled approval and documented testing. This division keeps a semi-automated line practical without weakening the audit trail.
Validate the result and the response
Validation must cover more than prediction accuracy. Test missing, delayed, duplicated, out-of-range, and cross-site inconsistent data. Confirm that alarms are logged, users can identify the approved response, and the system fails safely when a signal becomes unavailable.
A quality review should ask four questions:
- Can we trace it? Identify the original source and every transformation.
- Can we reproduce it? Recreate the result with the recorded model and configuration.
- Can we control it? Restrict changes through permissions, approvals, and procedures.
- Can we act on it? Connect the output to an approved workflow and record the disposition.
The GMP manufacturing guidance describes disciplined, repeatable process control. Begin with the loss your plant understands and can verify, then build analytics around that specific pain point. Put data governance in the initial design review. Retrofitting audit trails after deployment takes longer, costs more, and is harder to defend during an investigation.
Common Pitfalls and Best Practices for Sustainable Analytics
The costliest analytics error is often a poor operating model, not a poor algorithm. A technically accurate model and attractive dashboard still fail when operators, maintenance planners, or quality reviewers cannot use the output during an existing shift routine.
Use the following priorities:
| Common pitfall | Better practice |
|---|---|
| Over-investing in platform technology before defining the operational problem | Start with a specific use case tied to downtime, scrap, energy, or quality |
| Lack of clear business goals and no named owner for alerts | Build a cross-functional team spanning operations, maintenance, quality, controls, and IT |
| Ignoring data quality until a model produces unreliable results | Focus on data governance first, including lineage, timestamps, permissions, and validation |
Design around the failure modes
Do not start with a digital twin because it covers more functions. Start with a loss the plant already measures and can verify. For downtime, classify stops, confirm the event logic against PLC and SCADA records, and connect the result to a maintenance action. For scrap, establish part identity, recipe, batch, and process context before choosing a prediction method.
A focused use case also makes financial review more credible. Industry estimates have reported a 14-month median payback and median annual savings of USD 487,000 per plant, but those figures are directional rather than a promise for every facility. Treat them as context, then define the local baseline, implementation effort, expected adoption, and owner for the result. A smaller deployment with a clear payback path is usually easier to defend than a broad platform rollout built on assumptions.
Treat data quality as production engineering
Assign ownership for tag naming, time synchronization, sensor calibration, reason codes, and manual entries. In semi-automated lines, check how PLC states, SCADA alarms, operator inputs, and batch records align. A missing timestamp or duplicated event can misclassify a stop just as effectively as a misaligned fixture can damage a finished part.
Data quality checks must run after launch, not only during commissioning. Review false alarms, investigate missed events, and verify that operators can identify the approved response. If a signal disappears, the system should fail safely and mark the result as uncertain rather than generating a normal-looking value.
Sustainable manufacturing data analytics requires a feedback loop. Update the response procedure when the process changes, retrain users when alert behavior changes, and revise tags or thresholds through controlled change management. The line-level workflow matters more than adding another dashboard.
For manufacturers seeking practical production and service improvements, System Engineering & Automation provides semi-automatic systems, integrated controls, tooling, fixtures, and end-to-end engineering support grounded in real production constraints. Visit System Engineering & Automation to discuss a focused automation and analytics strategy that improves line performance, quality, safety, and maintainability without forcing an oversized platform investment.