The map above the supervisor's desk was current last quarter. Then a fixture changed, a recipe got edited in the MES, and the afternoon shift started a different mix. You walked the line this morning and the drawing no longer matched the work. Queues sat where the boxes said flow, and operators had already invented a workaround the map never captured.
That's the usual miss with manufacturing process mapping. The sheet gets treated as a finished poster. It should be a control model you re-check when equipment, software, or product mix changes. I would start with one product family, measure the actual constraint, and only then decide whether a fixture or a semi-automatic step beats a full cell. Most plants don't need a new line. They need the cheapest fix that closes a measured gap.
If you're trying to cut cycle time without locking the plant into equipment you can't validate or staff, the map is the decision tool. It shows where material waits, where people hand work off, and where a control signal arrives late.
Table of Contents
- Pick a Mapping Method That Fits Your Product Mix
- How to Build a Current-State Map Step by Step
- Spotting Waste, Bottlenecks and Hidden Delays
- Keeping the Map Validated for GMP-Aware Lines
- Choosing Tooling, Fixtures or Automation for Each Bottleneck
- Estimating ROI Before You Commit Budget
- Pilot One Change Before You Scale the Line
Pick a Mapping Method That Fits Your Product Mix
The wrong method wastes weeks. Answer three questions before anyone draws a box.
How many product variants share the line? A family of two part numbers is a different problem from a cell that changes every hour. Does the delay come from equipment, or from handoffs between people? A slow machine and a late quality release look the same on a clock and nothing alike on a drawing. Do timestamped ERP or MES records exist? If they don't, a data-linked map is a project you can't finish.
| Method | Best for | Data it needs | Typical effort |
|---|---|---|---|
| Value stream map | Whole product family, material and information flow | Cycle times, inventory, changeover, takt | Medium to high |
| Process flow chart | One process with decisions and rework loops | Step list and cycle time per step | Low |
| Swim-lane map | Handoffs between operators, QA and systems | Roles, handoff times, where records are kept | Low to medium |
| Data-linked digital map | Variable product mix with ERP or MES data | Timestamped ERP/MES events plus floor observation | High, needs IT access |
A machining cell running two part numbers on one shift fits a process flow chart. You can draw it in an afternoon from a step list and a cycle time on each box. A three-shift assembly line where QA holds and rework loops cause most of the delay fits a swim-lane map, because the handoffs are the story, not the machine cycle.
The NIST Hollings Manufacturing Extension Partnership names value-stream mapping, 5S, Toyota Kata, and Six Sigma as practical methods for small and midsized manufacturers. Since 2000, the MEP National Network has worked with 77,409 manufacturers, generating $60.0 billion in new sales and $26.2 billion in cost savings. In fiscal year 2024, nearly 95% of surveyed participants represented companies with fewer than 500 employees. This is ordinary shop-floor work, not a software rollout.
Pick the lowest-effort method that answers the question you have. Name one owner. Set a date for the first draft this week, and leave the digital map until the paper version has earned it.
How to Build a Current-State Map Step by Step
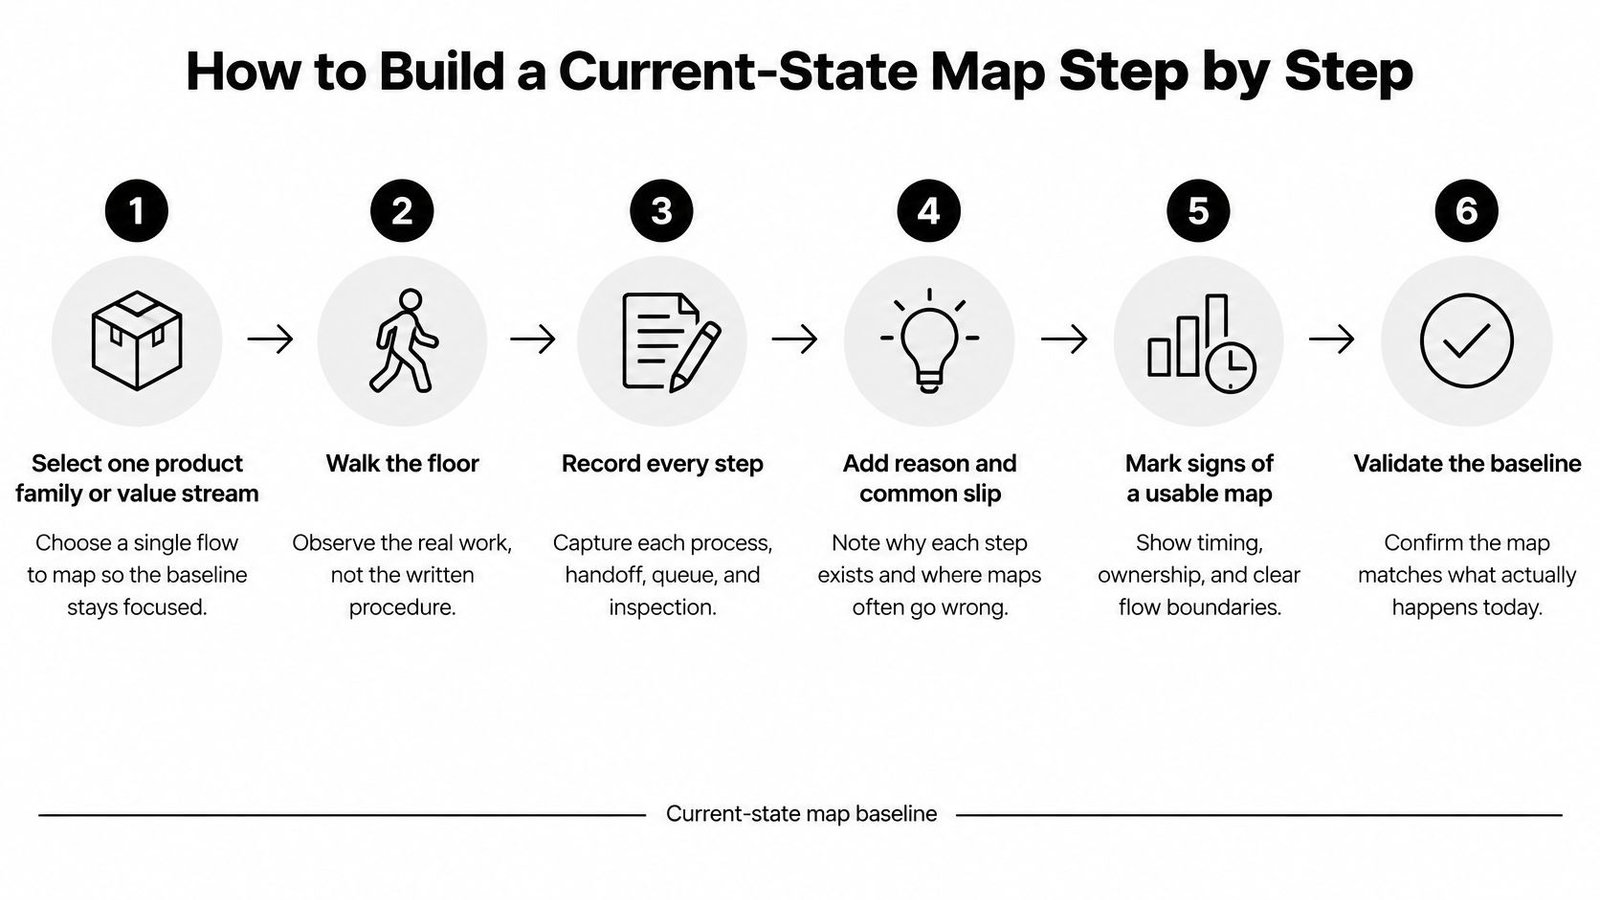
A usable baseline is observed work, not a cleaned-up procedure. NIST's value stream mapping guidance treats the exercise as a four-stage cycle: select the family, document material and information flow, define a measurable future state, then implement. The six steps below stop at a baseline you can trust.
Walk it before you draw it
- Select one product family or value stream and write the start and end points on the sheet. Mapping the whole plant hides the constraint inside unrelated flows. The usual slip is scope creep by lunchtime.
- Assemble a small team: one operator, a supervisor, a quality person, and an engineer. Agree the data list before anyone walks. Leaving operators out produces a map of the procedure, not the job.
- Walk the path with a pencil. Record each step, queue, inventory point, and information handoff in the order they happen. Don't rearrange steps into a logical sequence. Logic is how the delay got designed in.
- Time each major step over several shifts, including changeovers. One morning sample hides product-mix, downtime, and staffing variation. NIST is explicit that averages conceal those swings, so repeated observation is the control, not a nicety.
- Draw material flow along the bottom and information flow along the top. Mark the pacemaker and every point where a production signal arrives late or gets distorted.
- Check every number with the operators before you call the map finished. If they don't recognize the drawing, you mapped a meeting, not the line.
What a finished baseline looks like
Collect observed cycle times, changeover times, available capacity, queue or inventory levels, staffing, quality losses, and information handoffs directly from the process. Then separate value-added work from the rest.
Practical rule: Every box has a measured time, every queue has a count, and an operator can point at the drawing and say that's their job.
An unmaintained map goes stale as soon as materials, equipment, or variants change, which is why standard work and a recurring measurement date belong on the same sheet as the boxes. The output you want is a future-state map tied to owners, dates, and KPIs such as lead time, first-pass yield, throughput, work-in-process, and equipment availability.
Those measured cycle times, throughput figures, and quality losses are the KPI baseline you'll use when you pilot one change later. We run that evaluation across the full workflow, looking for where a change would cut cycle time, raise throughput, lower labor dependency, or tighten quality control, and we only flag automation where that impact is largest.
Spotting Waste, Bottlenecks and Hidden Delays
A neat current-state drawing can still lie. Conventional maps capture one representative run. Recent manufacturing research from RWTH Aachen argues that this analog snapshot misrepresents flexible production because it ignores product-family differences and changing conditions, and because mapping methods aren't tied to event data from ERP and MES. The same work flags practical barriers: system outages, bad data migration, weak database quality, poor version control, and limited IT skill on the floor.
A box that looks like labor waste can hide changeovers, quality holds, rework loops, downtime causes, or variation that follows a particular operator.
| Waste or constraint | How it shows on the map | What to measure |
|---|---|---|
| Waiting and queues | Stacked boxes or wait symbols between steps | Queue count and wait time per batch |
| Rework loops | Arrows that return to an earlier step | Rework rate by shift and by operator |
| Transport and motion | Long arrows and repeated walking paths | Distance walked and reach time per cycle |
| Overprocessing | Extra inspection or handling boxes | Steps that can be removed without quality loss |
| Excess inventory | Work-in-process piles between steps | WIP count at each point, measured at peak |
| Defects and holds | Scrap or hold markers at specific steps | Scrap, hold count and first-pass yield per step |
| Constraint or pacemaker | The step with the longest cycle and the longest queue ahead of it | Cycle time against takt across several shifts |
Compare cycle times across shifts, not against a single "typical" part. The pacemaker is the step that sets the rate the line can hold. The true constraint is that step when the longest queue also sits in front of it. Speeding a non-constraint only builds a bigger pile ahead of the bottleneck. Bottleneck identification starts with that comparison, not with a wish list of new machines.
Long batches hide the same problem. Queue time and delayed quality feedback disappear inside the batch and show up the moment you imagine the flow as single pieces.
On one medical-device line, watching the process beat reading the drawing. An unused edge feature on the product, something no box had recorded, held the key to the problem.
Map by hand first. Instrument only the high-impact steps. Reconcile ERP or MES timestamps with what operators report, and automate only where that evidence shows a measurable return. This week, pull queue time, rework rate, and hold count for your top three signs and see which one the drawing understated.
Keeping the Map Validated for GMP-Aware Lines
A new machine, software revision, or product variant can change what a production step controls. On a GMP-aware line, the process map must show which steps need inspection and which need validation. More automation does not reduce the documentation required.
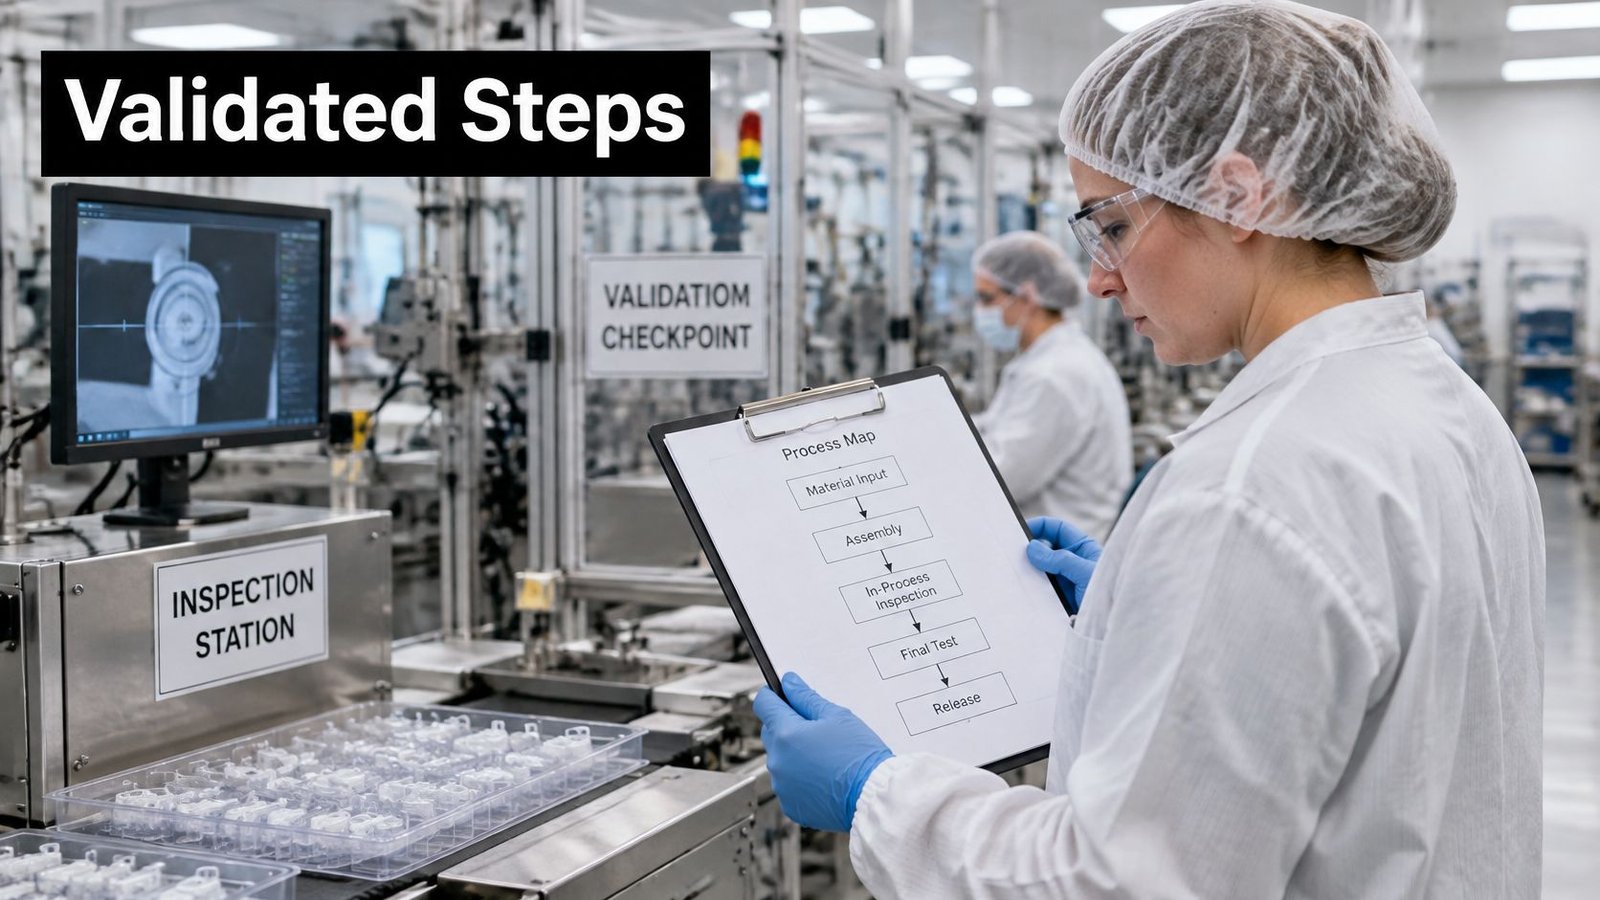
FDA process validation guidance defines process validation as documented evidence that a process consistently produces results meeting predetermined specifications. When inspection and testing cannot fully verify the result, the process must be validated with a high degree of assurance. Document and approve the activities and results, and ensure qualified people run the validated process. The guidance also calls for defining product and process flow, identifying steps requiring validation, setting protocols and specifications, and recording approvals.
Decision rule: inspect a defect if it can be seen or measured after the step. Validate controlled parameters when the finished part cannot fully reveal whether the process was performed correctly. Sealing, bonding, assembly, and software-controlled operations may require validation because their results depend on parameters that are not fully visible in the final product.
Controls the drawing has to name
For an automated or software-driven step, show the control system, sensors, recipes, data records, alarms, and operator screens on the map. These elements are part of the process being controlled, not side notes for an integrator. If one changes, the map may no longer describe the validated setup.
FDA guidance on production software requires medical-device manufacturers to validate computer software used in production or the quality system for its intended use under 21 CFR 820.70(i). The validation file needs user requirements, a protocol, acceptance criteria, test cases and results, and a summary. Test critical parameters against the stated criteria.
Manufacturing drawings start after the full design is finalized and approved. They specify what production needs. Keep that sequence clear in the map's revision history, so each update can be tied to the approved design and validated process. Otherwise, every map revision becomes an argument about which version was validated.
Recheck the map when equipment alters a controlled parameter or qualified setup, when a recipe or software change affects alarm limits or operator screens, or when a product variant uses the same equipment under different settings. Also review it after a deviation if the root cause touches a validated step.
Treat the map as a living control document. Revisit it whenever equipment, software, or product mix changes. A step requiring validation can increase the burden of changing it, so include that impact when comparing a fixture, a semi-automatic step, or a larger equipment change.
Choosing Tooling, Fixtures or Automation for Each Bottleneck
Start at the constraint the map measured and climb only as far as the gap requires. Layout and standard work cost the least and often close a method problem that looked like an equipment problem.
| Option | Use when | Typical change | Watch for |
|---|---|---|---|
| Layout and standard work | The delay comes from method or layout, not equipment | Re-layout, standard work, 5S | Gains fade without regular audits |
| Custom tooling and fixtures | Parts shift, hold poorly or vary between operators | Locating fixtures, holding tools, consistent assembly or welding | Locators can mark part surfaces |
| Manual with improved fixtures | Demand is low and the goal is better quality | Better tools and in-process checks | Throughput gains stay limited |
| Semi-automatic workstation | Demand is rising and the operator should stay in control | Automates pressing, dispensing, testing, labelling or packaging | Operator dependence remains |
| Fully automated line | Stable high volume with a repeatable product | Integrated cell or line with full controls | Validation and maintenance burden; long payback if volume drops |
Custom tooling and fixtures earn their place when parts shift, hold poorly, or vary because operators compensate by hand. Locating nests and holding tools make assembly or welding repeatable. The risk is real: locators can mark the surface, so the fixture design has to protect the finish the customer sees.
Manual equipment is the better call when demand is low, or when the aim is better quality than the current hand method. Throughput will stay limited, and that's acceptable if volume isn't the constraint.
A semi-automatic station often starts as a tooling-first upgrade. The operator stays in the loop, loading, starting, or unloading, while the machine handles the repetitive press, dispense, test, label, or pack. We can design that tooling so a manual station grows into a semi-automatic one as demand rises, without a full overhaul. Tooling and fixtures are the usual first hardware step when the map shows variation between operators rather than a capacity ceiling.
Full automation belongs last, on a stable, high-volume, repeatable product. If volume drops, payback stretches and the validation and maintenance load stays.
Match the intervention to the constraint's measured gap. Don't automate a step the map shows is not limiting output.
Before you commit, score each option against the validation burden already on that step. A change to an inspect-only step is cheaper to prove than a change to a sealed, bonded, or software-controlled one. If two options close the same gap, take the one that touches fewer validated parameters.
Estimating ROI Before You Commit Budget
Price the benefit in three buckets, or the spreadsheet will flatter the wrong project. Labor hours released is the easy one. Scrap and rework cost avoided is the second. Throughput value is the bucket teams skip, and it's often the largest.
Machine speed is a weak proxy for that third bucket. In an NIST MEP case study, TLT used single-piece flow and smaller batches and reported a 23% increase in sales in the year after lean practices were reintroduced. Lead time and the ability to answer demand showed up as revenue, not as a faster spindle.
A payback you can rerun
Use total project cost divided by annual net benefit. The figures below are assumed so you can see the arithmetic. Swap in your own.
Say a fixture set costs $42,000. It saves one operator hour per shift on two shifts, 250 days a year, at a loaded labor cost of $35 per hour, and it cuts scrap by 3% on $120,000 of annual output value.
- Labor: 1 hour × 2 shifts × 250 days × $35 = $17,500 a year.
- Scrap avoided: 3% × $120,000 = $3,600 a year.
- Annual benefit: about $21,100.
- Payback: $42,000 / $21,100, roughly two years.
Count only savings you can measure over three months of running. Subtract new maintenance, software, and training before you divide. If payback runs longer than the equipment's useful life, or longer than the product's expected run, the project isn't worth it.
We walk manufacturers through that financial picture before hardware is specified, so a faster cycle isn't mistaken for a better investment. You can pressure-test your own buckets with an automation ROI calculator using the same three lines: labor, scrap, and throughput.
Pilot One Change Before You Scale the Line
Pick the bottleneck with the highest measured impact and the lowest validation burden. Run it on one cell, or one shift, for a fixed period. A line-wide rollout before that test is how a scratched part becomes a recall discussion.
Set the test before you start
Write the future state in numbers first. A lead-time target per batch and a first-pass yield floor turn the pilot into a test of a defined target, not a general hope. Record the baseline from the map: lead time, first-pass yield, throughput, work-in-process, and equipment availability.
Set go or no-go criteria in advance. Examples that hold up in a review: lead time must drop by the amount you wrote down, and scrap must not rise. If you invent the pass mark after the data arrives, the pilot can't fail, which means it can't teach you anything.
Watch for what the drawing can't predict
During the run, log side effects next to the KPIs. On a medical-device semi-automated system, locator pins on a rotating dial positioned the product correctly and scratched the surface. The cycle time looked fine. The parts did not. Operator comments belong in the same log as the scrap count, because the pins only showed the problem once the dial was turning.
After the window closes, compare results with the baseline and update the map. The future state you just proved is the new current state. If the criteria miss, stop. A fixture tweak or a standard-work change is still available, and it is cheaper than scaling a scratch into every shift.
Bring the updated map to a no-obligation consultation. We'll want your current bottlenecks, labor and production constraints, quality concerns, budget, and timeline, and we'll review the map before any equipment is specified.
System Engineering & Automation designs the level of equipment your map justifies, from fixtures and manual upgrades through semi-automatic workstations and full cells, with GMP-aware documentation where the process requires it. If your current-state drawing and your payback math are ready, bring them to a review before you specify hardware. Visit System Engineering & Automation to start that conversation with your bottlenecks, constraints, and timeline.