Your operator has checked clamps at the torque station all shift. Near the end of a long run, a loose clamp slips past, and now you're deciding which parts to quarantine while production waits. Another inspector might help, but you're also wondering whether a fixture, connected torque tool or automated check could prevent the same problem without rebuilding the line.
That's the practical starting point for manufacturing quality control automation: choose the smallest dependable system that controls the risk, fits your product mix and produces evidence you can use.
Table of Contents
- What Quality Control Automation Means on the Shop Floor
- Choosing Manual, Semi-Automatic or Full Automation
- How Sensors, Vision, PLCs and MES Work Together
- Validation and GMP Rules Before Automated Release
- How to Roll Out Automated Inspection Step by Step
- What Returns to Expect and How Small Plants Measure It
- Pitfalls to Avoid and How to Mitigate Them
- Confirm Your Automation Level Before You Buy
What Quality Control Automation Means on the Shop Floor
At that torque station, the problem isn't that someone missed a defect. The process depends on a person noticing every abnormal condition while also loading parts, following the sequence and keeping pace. An automated check can confirm clamp position, verify the fastening result and prevent an incomplete assembly from moving forward.
Think of a supermarket scanner compared with a cashier counting and identifying items by eye. The scanner applies a repeatable method, but it still needs correct labels and someone who knows how to clear a jam. Inspection equipment works the same way: consistency comes from a controlled setup, not from removing people.
Detect, decide and record
A useful quality-control system performs three distinct jobs:
- Detect: Measure or inspect the part, such as confirming clamp position or checking a torque result.
- Decide: Accept the assembly, reject it or stop the sequence when the result fails an objective criterion.
- Record: Associate the result with the part or lot, station and time so quality staff can investigate it later.
The operator remains central to handling exceptions and responding to abnormal conditions.
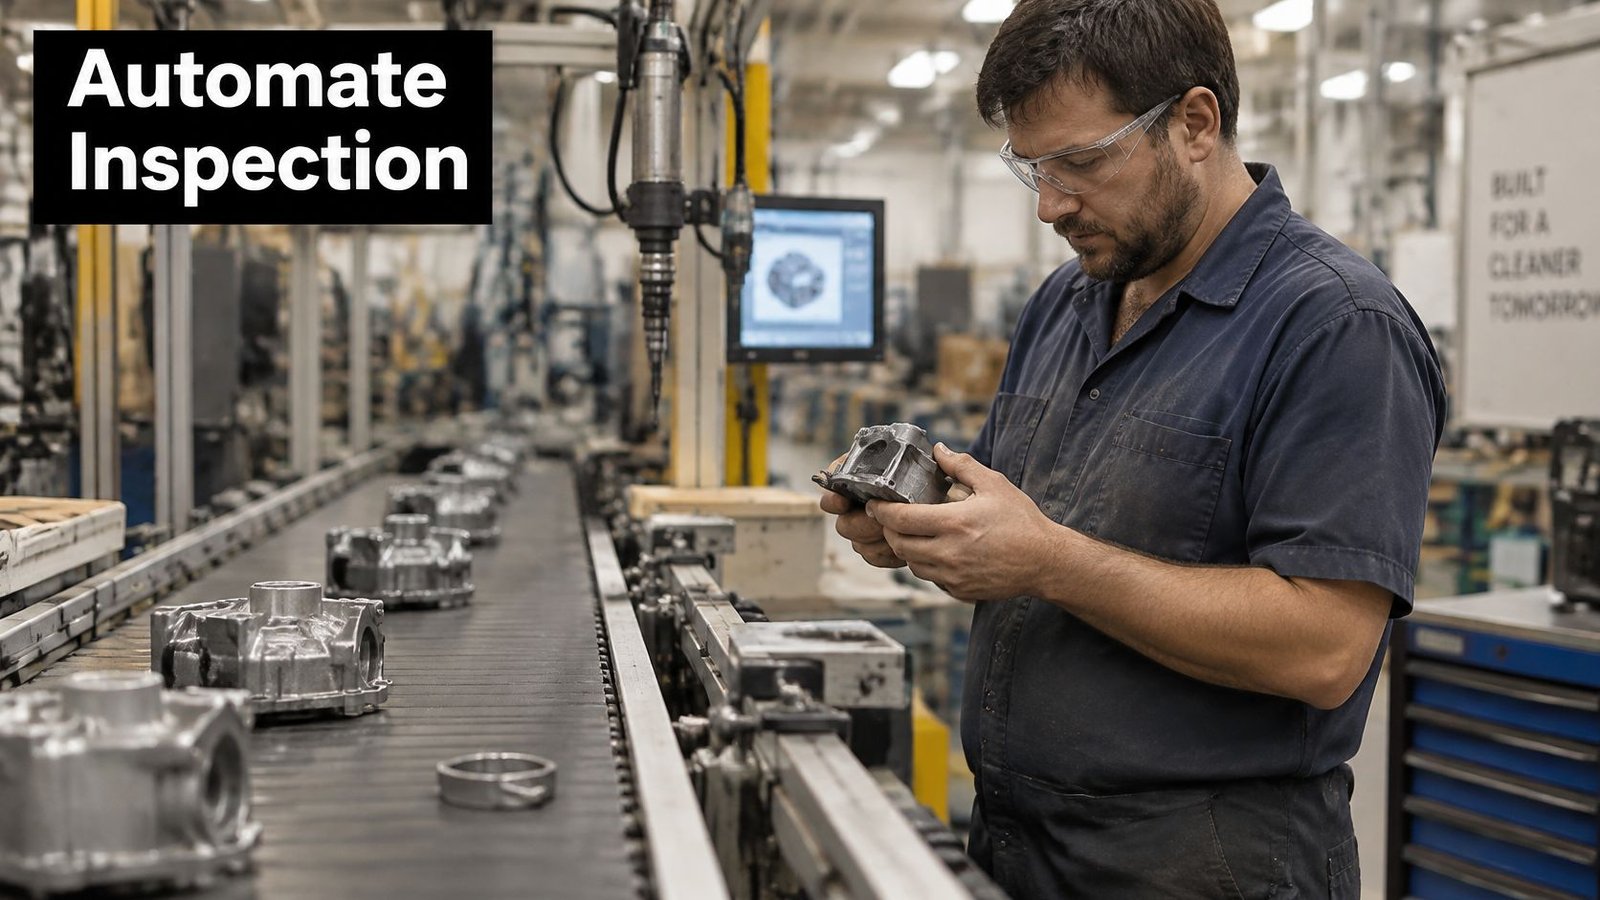
Manufacturers using automation often reduce scrap and rework, improve inspection consistency and lower customer-return costs. Those outcomes depend on whether engineers control the failure mechanism rather than merely add another inspection checkpoint.
Automation doesn't have to mean robots. Fixtures, gauges, conveyors, poka-yoke mistake-proofing and programmable logic controller logic can all provide useful control.
The working definition is straightforward: machines, sensors and software detect, decide and record quality without depending on a person to notice every problem. Start by identifying the defect with the greatest cost or consequence and the inspection step restricting production.
Choosing Manual, Semi-Automatic or Full Automation
Automation levels compared for quality control
| Level | Best fit | Typical inspection method | Changeover effort | Validation burden |
|---|---|---|---|---|
| Manual inspection with gauges | Low volume, many SKUs, low defect cost | Operator with calipers, go/no-go gauges, visual standards | Low | Light |
| Semi-automatic workstation | Mid volume, variable mix, tolerance-critical steps | Smart fixtures, poka-yoke, automated gauging, barcode checks, operator-initiated cycle | Moderate | Moderate |
| Automated inspection cell | Stable product, repeatable defect type, steady volume | Machine vision, sensors, PLC pass/fail logic, reject gate | Higher, needs recipe changes | Substantial |
| Fully automated inline line | Very high volume, fixed product, strong traceability needs | Vision and robotics linked to MES, full data capture | High, planned shutdowns | Extensive |
These are planning categories, not compliance exemptions. A manual gauge used for a critical dimension still needs suitable measurement evidence; a simple automated reject decision can require substantial testing.
Low volume and many stock-keeping units usually favor manual or semi-automatic inspection. Manual equipment is typically recommended when production demands are low or when a manufacturer wants better quality than traditional manual operations provide. A stable product and recurring, clearly defined defect make a dedicated cell easier to justify.
Size the investment around the constraint
Compare the alternatives against these operating conditions:
- Defect cost: Include containment, lost material, rework and customer consequences, not just the rejected component.
- Inspection labor: Separate hands-on inspection from loading, walking, recording and waiting.
- Takt time: Confirm that inspection and exception handling fit the required production pace.
- Product variation: Count fixture swaps, recipe changes and new defect standards.
- Expected uptime: Consider maintenance access, spare parts and recovery from faults.
- Validation burden: Budget for evidence generation and later changes.
- Payback period: Use achievable net savings rather than ideal cycle-time estimates.
Interest in advanced inspection doesn't settle the sizing decision. In a survey of quality leaders across the U.S., U.K. and Germany, 99% had adopted or planned to adopt AI, but only 33% were using it at the time, according to the Metrology News survey coverage.
Practical rule: A targeted workstation upgrade can beat a fully automated line when the product mix changes faster than the equipment can economically change over.
Smart fixturing, automated gauging or barcode-guided inspection may control the important risk without introducing automated loading and transfer problems. At System Engineering & Automation, we design new equipment and improve existing manufacturing processes and equipment, integrating technologies such as robotics, vision systems, PLCs and sensors where they fit.
Preserve an upgrade path with spare control capacity, accessible sensor mounts and defined interfaces for vision and a manufacturing execution system. Expansion should require an engineered addition, not replacement of the station.
How Sensors, Vision, PLCs and MES Work Together
An inspection line works something like a body. Sensors are the nerves, reporting presence and position; vision is the eye, measuring features and reading codes. The PLC is the reflex, executing time-critical actions, while supervisory control and data acquisition, or SCADA, provides the control-room view of trends and alarms.
The manufacturing execution system, or MES, provides production memory and coordination. It connects inspection results to work orders, lots and operators rather than leaving them isolated inside a camera or controller.
The diagram shows how these layers relate.

Core technologies in automated quality control
| Technology | Role in quality control | Data it produces | Common limitation |
|---|---|---|---|
| Photoelectric and proximity sensors | Confirm part presence and position | On/off signals, part counts | Cannot see surface defects |
| Machine vision camera system | Measures dimensions, reads codes, finds surface defects | Pass/fail results, measurements, images | Lighting and lens changes shift results |
| Torque and force tools | Verify assembly parameters | Torque and angle curves per cycle | Needs regular calibration |
| PLC | Runs the sequence and reject logic | Cycle status, alarms | Limited data storage and history |
| SCADA | Real-time monitoring, trends and alarms | Dashboards, historical trends | Not a reliable record on its own |
| MES | Links results to work orders, lots and operators | Traceability records | Needs integration effort with each machine |
A SCADA installation can support dependable historical records, but only when engineers explicitly design retention, access, time synchronization and recovery. A dashboard alone isn't proof that the underlying record is complete.
For vision inspection systems, define the optical task before selecting the camera. Reading a printed code, detecting a missing clip and measuring a reflective edge require different lighting, presentation and acceptance tests.
Turn readings into process decisions
Store the measured value, unit, timestamp, device identity, recipe or revision, station and disposition reason. Include operator identity where relevant, and define what happens if the record cannot be saved. Otherwise, a part may physically pass inspection while its required traceability disappears.
Don't reduce every measurement to a green or red light. A passing dimension near a limit contains information that a simple pass result loses.
NIST's statistical process control guidance describes comparing current measurements with historical process behavior using control limits. Establish those limits from representative, stable production data rather than copying the drawing tolerances.
Specification limits describe acceptable product. Control limits describe expected process behavior. A process can remain within specification while shifting in a way that warrants investigation.
When engineers correlate measurements with tool changes, fixture adjustments and recipe revisions, they can distinguish routine variation from assignable causes. Tool wear, fixture misalignment, lighting changes and calibration drift demand different corrective actions.
Every measurement also carries uncertainty. Verify the measurement system before its output drives rejection, process adjustment or release decisions, especially when the acceptance window is narrow.
Validation and GMP Rules Before Automated Release
For medical-device manufacturers selling finished devices in the United States, the Quality Management System Regulation became effective on February 2, 2026, incorporating ISO 13485:2016, according to the FDA's overview of device regulation. Production equipment and control systems therefore need to support documented, repeatable processes within the manufacturer's quality-management framework.
The FDA's medical-device inspection guide explains the objective-based approach to quality requirements: manufacturers select appropriate methods and defend their adequacy. Treat its legacy regulatory references carefully under the current framework, and document the rationale for any applicable “where appropriate” exclusion.
Match evidence to the failure risk
Under the FDA's software validation guidance, production and quality-system software needs validation for its intended use, and processes whose results cannot be fully verified later require validation with a high degree of assurance. Ask a plain question: if this function fails, will a later check reliably catch the affected product?
Validation expectations by automated function
| Automated function | Validation expectation | Evidence to keep |
|---|---|---|
| Accept or reject decision | Full validation against objective acceptance criteria, including challenge samples | Validation protocol, test cases, recorded results, summary |
| Measurement gauge or vision measurement | Measurement system qualified and uncertainty known | Calibration records, repeatability and gauge studies |
| Label verification | Correct label confirmed, incorrect labels rejected reliably | Label template revisions, reject logs, change records |
| PLC logic and recipe changes | Change control with impact assessment before release | Change requests, approvals, audit trail |
| Networked data historian | Access permissions, backups, cybersecurity risk review | Access logs, backup restore tests, patch records |
Test challenge samples, boundary conditions, power-loss recovery, sensor failures and repeatability before release. Record objective acceptance criteria rather than relying on a commissioning note that says the station worked.
The FDA's labeling requirements guidance identifies labeling as part of the device master record under the legacy framework and calls for formal change control. Keep label templates, inspection recipes and approved product configurations aligned within the current quality system.
Networked cameras and historians also expand the attack surface. Assign access permissions, audit trails, backups and patch ownership in the validation plan; the FDA's computer software assurance guidance notice supports a risk-based approach to production and quality-system software assurance.
For broader context, GMP in manufacturing connects equipment controls with documented operating practices. Outside medical devices, apply the same evidence logic to applicable customer and ISO quality-system obligations without assuming identical regulatory requirements.
How to Roll Out Automated Inspection Step by Step
Start with a bounded station rather than an entire line. Our team evaluates production workflows to identify where automation can create the greatest impact; during a no-obligation consultation, we examine current bottlenecks, labor and production constraints, quality concerns, budget and timeline expectations.
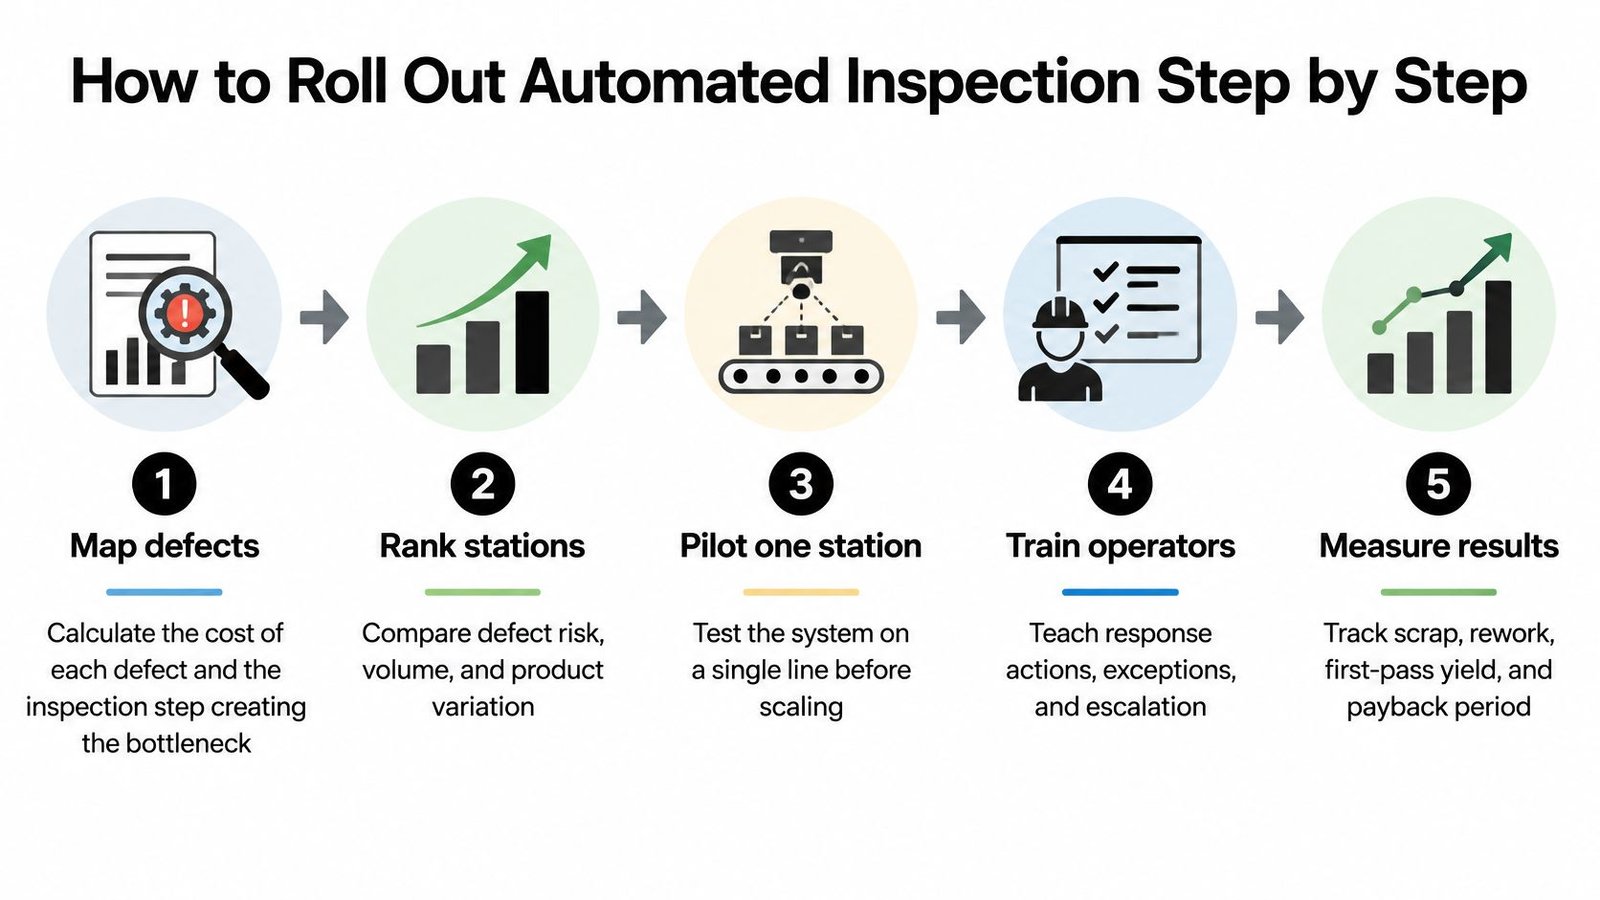
The overview below captures the implementation priorities.
Build and prove the station
Map defect cost and the inspection bottleneck. Include the labor and material added before a defect is discovered. The common slip is targeting an obvious inspection task while ignoring the upstream operation creating the loss.
Rank candidate stations. Compare defect risk, volume and product variation to select a manageable pilot. Avoid automating an unstable process just because its scrap bill is high.
Verify the measurement system. Use repeatability and gauge studies with representative operators, fixtures and parts. Automating an unreliable gauge produces unreliable decisions more consistently.
Write user requirements and acceptance criteria. Define measurable defects, cycle requirements, traceability, fault responses and responsibilities. Avoid requirements such as better inspection that nobody can objectively test.
Choose the automation level and upgrade interfaces. Reserve practical connection points for later sensors, vision or MES integration. Don't compromise maintenance access just to make the enclosure smaller.
Complete factory and site acceptance testing. Challenge the equipment with normal and worst-case samples before shipment, then verify it under actual line conditions. A factory demonstration doesn't prove performance with plant vibration, lighting, utilities and handling.
Run automated and manual inspection in parallel. Set an agreed comparison period and resolve disagreements against a trusted reference method. Skipping this step can conceal false rejects as well as dangerous false accepts.
Release, train and review. Train operators on normal cycles, exceptions, escalation and recovery, then assign a review cadence. A signed handover without trained shift coverage isn't a controlled release.
Design for the people maintaining it
The FDA's overview of quality-system process controls emphasizes equipment designed, placed and installed to support maintenance, adjustment, cleaning and use. Accessible layouts, adjustable tooling and visible inspection points help engineers preserve those conditions after commissioning.
Don't locate a frequently cleaned lens behind fixed guarding that requires lengthy disassembly. Give maintenance staff access to sensors and provide controlled adjustment methods so servicing doesn't unintentionally alter acceptance decisions.
The accompanying video offers another view of manufacturing automation.
At the end of parallel operation, success means more than matching totals. The team should understand every decision disagreement, demonstrate reliable containment and recovery, and confirm that inspection keeps pace under representative production conditions.
What Returns to Expect and How Small Plants Measure It
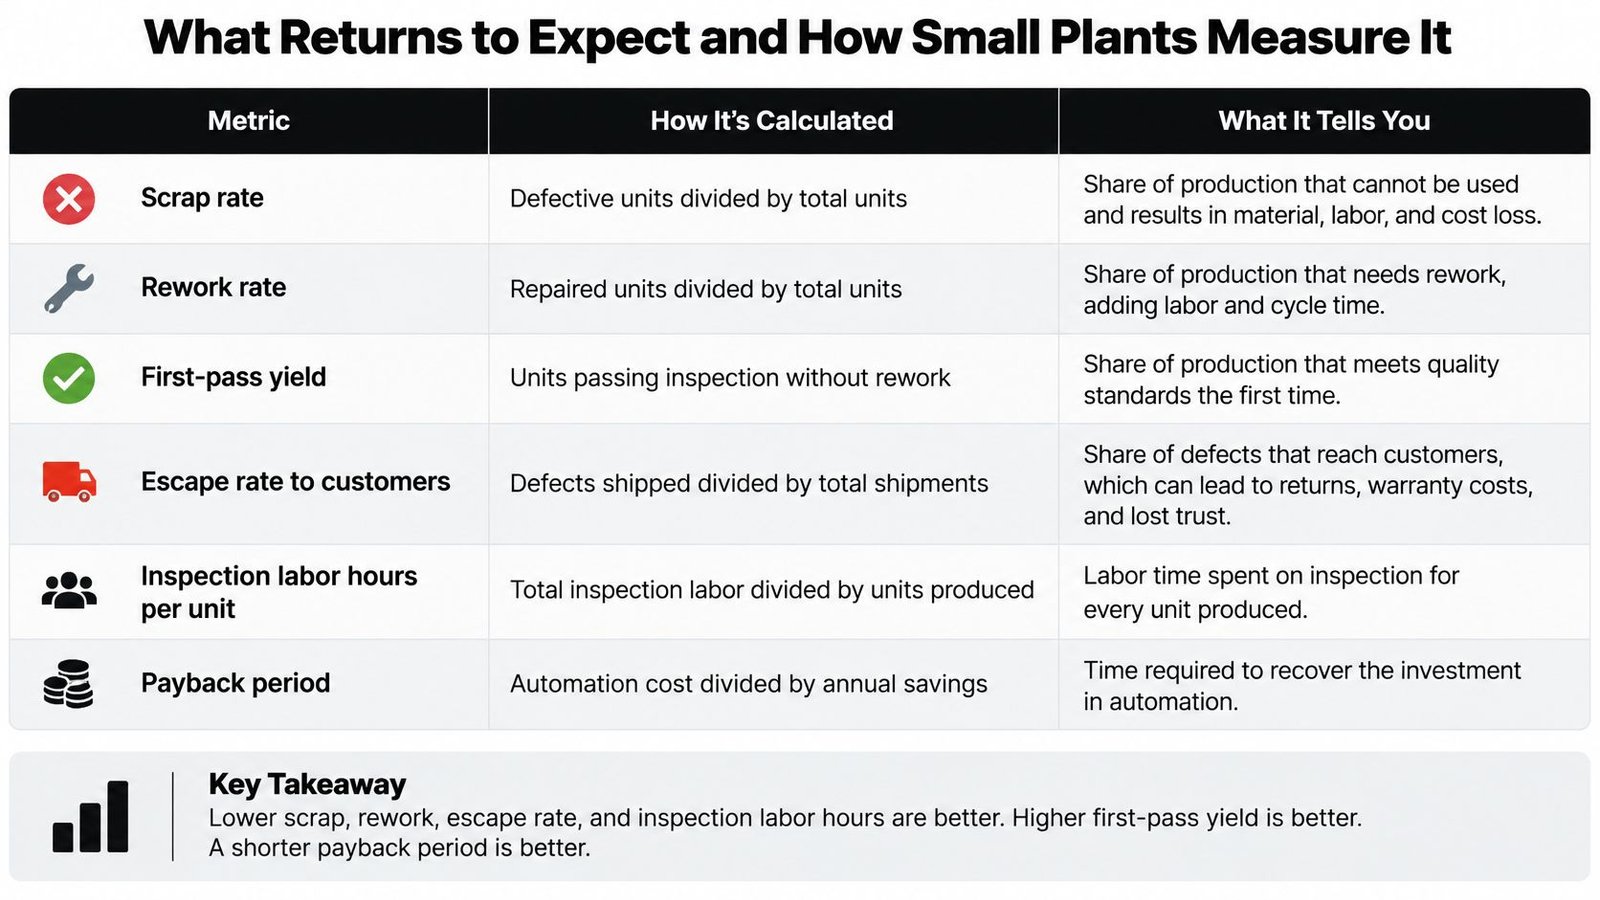
Metrics that prove automation returns
| Metric | How to calculate | Healthy direction | Review frequency |
|---|---|---|---|
| Scrap rate | Scrap cost divided by good output | Falls after rollout | Weekly |
| Rework rate | Reworked units divided by total units | Falls after rollout | Weekly |
| First-pass yield | Units passing first time divided by units started | Rises | Daily |
| Escape rate to customers | Returned or warranty units divided by units shipped | Falls | Monthly |
| Inspection labour per unit | Inspection hours divided by units produced | Falls or hours redeployed | Monthly |
| Payback period | Investment divided by monthly net savings | Within the agreed target | At each review |
Use consistent units. In this table, scrap cost divided by good output is a cost-per-good-unit measure, not a unit-based scrap percentage; customer returns are also a practical indicator of escapes, not a complete count of every defect shipped.
Build a representative baseline before changing the station. Capture product mix, scrap, rework, inspection hours and downtime across normal production and changeovers rather than selecting an unusually good shift.
The visual summarizes the performance measures, but the calculation definitions in your project should remain consistent.
Separate financial savings from released capacity
Payback in months equals investment divided by monthly net savings. Include installation, integration, validation and training in the investment, and subtract calibration, software support, maintenance and refresher training from ongoing benefits.
Annualized return uses annual net benefit relative to investment. Keep its time basis separate from monthly payback, and use a structured automation ROI assessment to distinguish cash savings from additional capacity.
Moving an inspector to packing releases useful capacity. It doesn't automatically remove a payroll expense.
Composite scenarios for sizing the project
Composite A, a housing manufacturer. Suppose operators visually check every housing in a high-volume product family, but detect assembly errors only after additional processing. A vision-guided semi-automatic station checks earlier, scrap falls and the inspector moves to packing.
The relevant measures are scrap cost per good unit and inspection labor per unit. The lesson is to value earlier detection and redeployment separately, without claiming both as the same saving.
Composite B, a medical-component plant. Suppose changing label formats create repeated setup checks and labeling rework. Poka-yoke fixtures and barcode verification reduce those errors without automating product transfer through the whole line.
Here, labeling rework and changeover effort matter more than maximum cycle speed. These are illustrative composites, not reported customer results; replace their assumptions with your own baseline before approving expenditure.
Pitfalls to Avoid and How to Mitigate Them
False accepts and false rejects are the most expensive inspection failures. A false accept sends a defect forward; a false reject consumes good material and investigation time. Routine sampling can miss either, so challenge the decision with known good and known bad parts before release.
Keep the system useful after commissioning
- Overbuying vision: Test real production samples, including marginal defects and acceptable cosmetic variation, before specifying hardware. A camera demonstration on clean reference parts doesn't establish production capability.
- Data without an owner: Name who reviews trends and who responds to each alarm. Define the response, escalation and closure record rather than assuming someone will notice a dashboard.
- Unowned cybersecurity: Assign responsibility for updates, backups, access reviews and audit-trail checks. Coordinate software changes with quality and production so patching doesn't bypass change control.
- Painful changeovers: Use keyed fixtures, controlled recipes and clear setup confirmation. Keep loading semi-automatic when frequent product changes would make automated feeding unnecessarily complex.
- No workable fallback: Write the manual inspection procedure and power-loss recovery sequence before production release. Rehearse recovery, including disposition of parts caught between inspection and recording.
Release discipline: If traceability or inspection is unavailable, the fallback must preserve the required quality controls, not merely keep the conveyor moving.
Also specify who may override a rejection and how that decision is recorded. An unrestricted bypass can defeat otherwise sound equipment, particularly when operators face pressure to restore output.
Confirm Your Automation Level Before You Buy
Use this readiness check before committing capital:
- Defect economics: Do I know the cost of each defect and where it's found?
- Measurement confidence: Is the measurement system verified?
- Product flexibility: Does my product mix change often enough to favor semi-automation?
- Lifecycle ownership: Do I know who owns validation, data and software updates?
If those answers are clear, select the lowest automation level that meets the defect-control and traceability goals, with an engineered upgrade path. Otherwise, begin with baseline collection and a measurement study.
System Engineering & Automation has over 30 years of hands-on experience in manufacturing and inline automation. In a no-obligation consultation, we review challenges, bottlenecks, quality concerns, budget and timeline, then evaluate the production workflow end to end for opportunities to reduce cycle time, increase throughput, lower labor dependency or strengthen quality control.
We also help manufacturers understand the financial benefits before committing to equipment. Your first action this week is to pull the last three months of scrap, rework and inspection data for the station you plan to change.
System Engineering & Automation offers practical manufacturing solutions, from tooling and semi-automatic workstations to integrated automation, with installation and ongoing support. Visit System Engineering & Automation to arrange a no-obligation consultation and bring your station data so we can assess the right automation level, production improvements and financial case.