Typical plants sit at 40–60% OEE, while world-class operations are often defined as 85%+. Downtime is commonly 15–25% in average plants and under 5% in top performers, so the first job is to stop bleeding capacity before you buy more equipment.
That gap is what most ops teams are staring at right now. The line looks busy, the schedule is full, and the numbers still don't add up because changeovers, unplanned stoppages, quality drift, and labor bottlenecks keep stealing output in small chunks that never look dramatic until month-end.
Table of Contents
- The Real State of Most Production Lines
- Building a Baseline You Can Trust
- Turning Data Into the Right Bottleneck
- Choosing the Right Level of Automation
- Integrating Tooling Fixtures and Controls
- Piloting ROI and Managing Real-World Risk
- Monitoring, Maintenance, and Sustaining the Gains
The Real State of Most Production Lines
Most plants don't fail because people aren't trying. They fail because teams keep treating a capacity problem like a shopping problem, and the shop floor keeps proving that more equipment is not the first answer.
A line can look healthy from the office and still leak output all day. The usual pattern is familiar, operators spend time clearing minor jams, supervisors absorb changeover pain as “normal,” maintenance gets pulled into firefighting, and quality finds drift only after scrap starts showing up in the bin.
The symptoms hide in plain sight
When a line is running “well enough,” the waste rarely shows up as one giant outage. It shows up as a dozen small losses that stack together, one extra setup here, a slow startup there, a station that keeps waiting on parts, and a rework loop that nobody wants to own.
Practical rule: if you can't point to the biggest lost hours by reason, you don't have a process optimization problem yet, you have a visibility problem.
That's why generic lean slogans fall short on a real floor. The right move is to identify the constraint, understand whether the loss is availability, performance, quality, or labor dependency, and then choose the fix that matches that constraint. For a baseline check on whether your operation is efficient, this efficiency benchmark guide is a useful reference point.
The four lenses that matter
I examine manufacturing process optimization through four lenses, because that's how plants recover capacity.
- Baseline first, because you can't improve what you haven't measured with discipline.
- Root cause next, because the loudest station is often not the bottleneck.
- Automation fit third, because the right answer might be smart tooling, not full automation.
- Sustainment last, because every gain that isn't controlled will drift back.
That sequence keeps you from overbuying technology and under-solving the problem. By the end of this roadmap, you should be able to tell which loss matters most, which station deserves attention, and which level of automation is worth the money.
Building a Baseline You Can Trust
Start with a floor that runs on facts, not assumptions. If your team cannot separate steady output from scrap, rework, and waiting time, every automation decision after that is a guess dressed up as a plan.
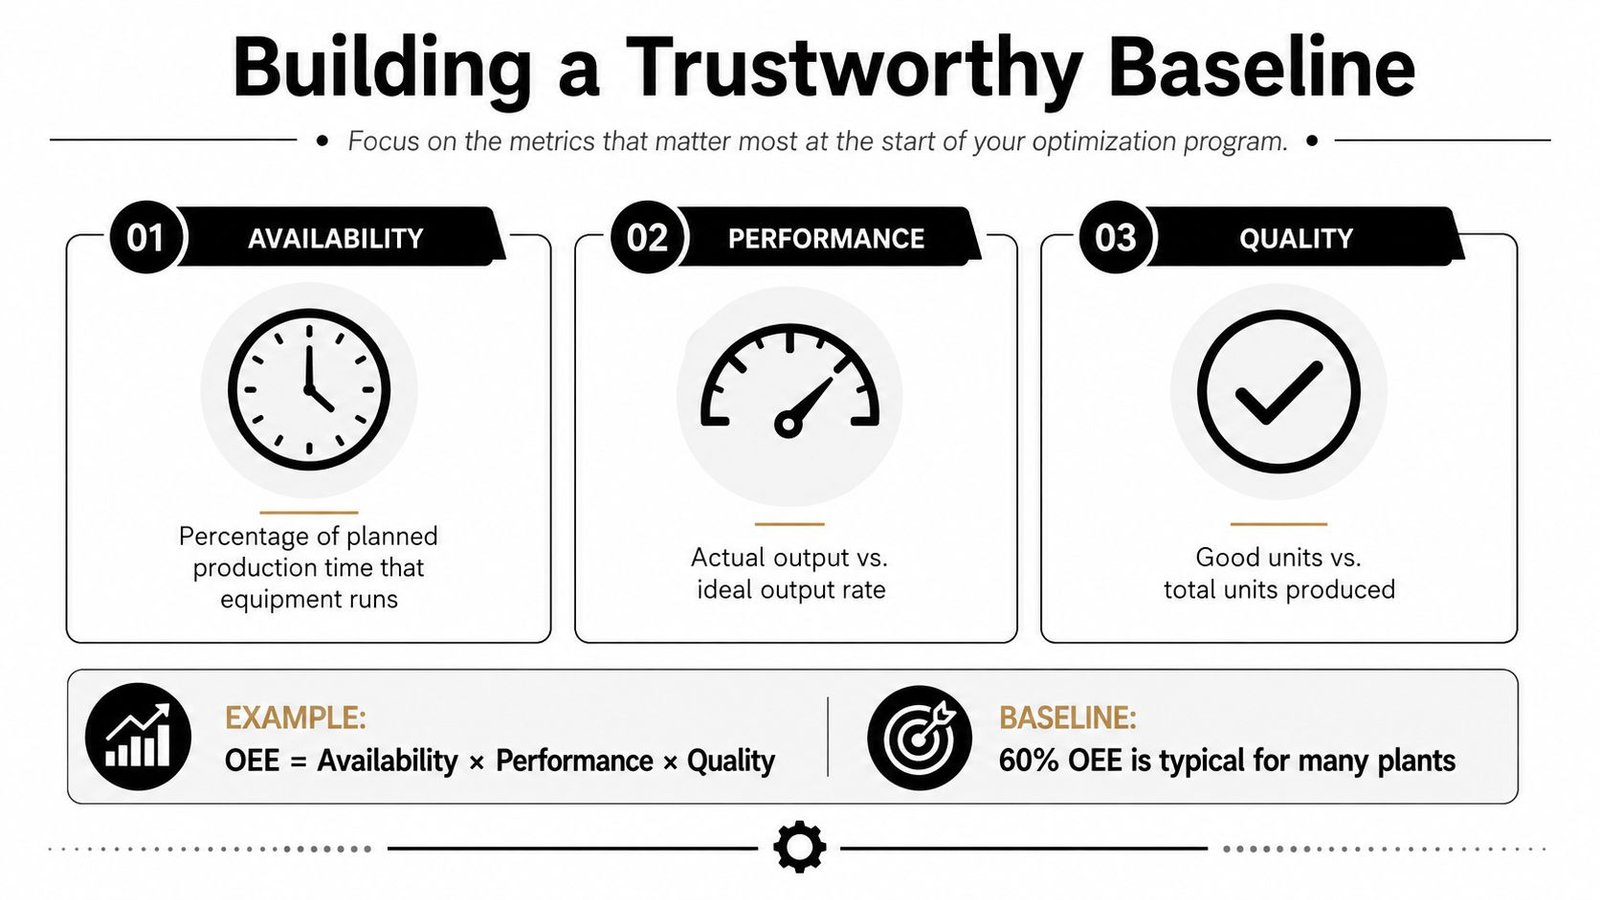
The first baseline should be narrow and useful. Track OEE, cycle time, first-pass yield, changeover time, downtime, and cost per good part. Those numbers expose where capacity disappears without drowning the team in dashboards nobody uses. OEE remains the cleanest shorthand because it rolls availability, performance, and quality into one view, but only if you split it into the specific loss you can correct.
Start with the numbers that move decisions
Measure the line before you touch the line. Capture current OEE, cycle times, defect rates, planned versus unplanned downtime, and energy consumption per unit. Then map each step so you can see which losses belong to the process, which belong to tooling, and which belong to control logic. That is the baseline work that supports manufacturing process optimization in practice.
Use the data your equipment already gives you first. If your PLCs and HMIs capture runtimes, stop reasons, counts, and faults, that is your starting point. If they do not, add temporary manual logs only where the machine data is blind, and keep the logging tight. You do not need a giant data program on day one. You need enough accuracy to separate real loss from guesswork, and tools such as machine monitoring software help when the line data is too thin to trust.
Know when the baseline is good enough
A baseline is good enough to act on when the same loss pattern shows up across shifts and the team can explain the top causes without fighting the numbers. In regulated environments, especially where traceability matters, keep the data trail tight and document how each metric is collected before you change anything.
A useful threshold: if the baseline changes every time a different supervisor interprets it, the problem is the measurement method, not the process.
That is why local vanity metrics cause trouble. A station can show strong utilization while the downstream cell starves, or a quality board can look clean while rework keeps eating labor. The baseline has to show the full picture, not the most flattering slice of it.
Turning Data Into the Right Bottleneck
A line can look busy and still be losing money at the wrong point. A station that screams for attention is often only the place where the constraint shows up first, not the place where the system is stuck.
Start by mapping the flow and forcing the losses into a simple ranking. Use 5 Whys for a clean cause chain, Ishikawa when the problem crosses people, methods, machines, and materials, and Pareto when you need to decide which few losses deserve time, cash, and engineering effort.
Rank the constraint, not the noise
On a mixed-manual line, the obvious culprit is usually wrong. The team blames cycle time, then the baseline shows the primary drag is changeover and startup loss. That matters because the steady-state run rate may already be acceptable, while the line still misses output because it spends too much time getting ready to run.
That is the value of evidence-driven improvement. It keeps you from spending money on a non-bottleneck and calling it progress. If a local fix pushes variation downstream, it is not a win, it is a postponed problem with cleaner numbers.
The manufacturing literature backs that discipline. In published DMAIC work, rejection rate dropped from 3.04% to 1.88% in 10 weeks, another case fell from 2.43% to 0.21%, and a Lean Six Sigma model reported up to 35% cycle-time reduction, 60% defect-rate reduction, and 25% OEE improvement. Those results come from the DMAIC and Lean Six Sigma evidence base, not from guesswork.
Use a simple impact-to-effort filter
Before you spend engineering hours, run the candidate loss through a blunt filter. If it does not move the bottleneck, park it. If the cause cannot be verified in the data this week, the team is speculating. If the fix only works with heroic operator behavior, it will fall apart as soon as schedules get tight.
For throughput-specific decisions, keep the question narrow and hard: which loss limits output, and what level of automation or control will remove it without wrecking flexibility? That is the logic behind throughput optimization, and it is the right way to separate a real constraint from a loud distraction.
Do not let the noisiest station set the improvement agenda. Let the bottleneck do it.
That shift changes the whole plant conversation. Once the team ranks losses by throughput impact, the work gets sharper, less political, and far more useful on a real shop floor.
Choosing the Right Level of Automation
A mixed-manual line does not need a grand automation program. It needs the right amount of automation at the right station, or you end up paying for speed you cannot use and flexibility you already gave away.
Start with the constraint, not the technology. If the product mix changes often, the operator still has to make judgment calls, or the process is under tight validation control, manual work with smart tooling often outperforms a bigger capital build. If the work is repetitive, stable, and volume-driven, semi-automation or full automation can carry more of the load without creating constant exceptions.
Match automation to the job
Manual stations with smart tooling belong on processes that change often, depend on operator judgment, or do not lose much time to manual handling. In that setup, the tooling does the discipline work, so the operator is not compensating for poor part location, poor guidance, or unclear setup.
Semi-automated cells are the better choice when the hard part of the task needs repeatability but the station still needs human loading, inspection, handoff, or exception handling. That is the zone where throughput improves without killing flexibility, and where a clean fixture plus clear controls often matters more than adding another machine.
Full automation belongs on stable, high-volume, repetitive work where the process is locked down and the economics are clear. If the line shifts product often, if changeover keeps eating time, or if validation burden is heavy, full automation can turn into an expensive way to buy speed you do not use enough.
The automation literature supports that call. An independent research summary reports that collaborative robots can increase production efficiency by 25% to 35% while improving labor productivity and safety, and predictive maintenance can reduce machine failure rates by 40% to 60%. Those gains show up when automation matches the constraint, not when it is forced onto the wrong station, as outlined in this automation review.
A practical decision screen
Use the same four questions every time before you commit.
- Volume: Is the station busy enough to justify the capital?
- Variability: Does the product mix change enough to punish rigidity?
- Labor dependency: Are you solving a shortage, a consistency issue, or both?
- Validation need: Will the installed system need formal proof before release?
High volume and low variability point toward full automation. High variability and heavy validation pressure point toward smart partial automation, usually with better tooling and tighter controls. In many plants, that is the better engineering answer because it keeps the line serviceable, keeps changeover under control, and avoids spending for capability the process does not need.
Integrating Tooling Fixtures and Controls
A station doesn't improve because you bought a robot, a fixture, and a PLC in separate chunks. It improves when the tooling, the fixture, and the control logic are designed together so the operator doesn't have to compensate for a bad interface.
That's where most retrofits go wrong. The robot gets blamed for a station that was poorly located, poorly clamped, or poorly sensed from the beginning.
Design the station as one system
Custom tooling and fixtures cut variability because they remove judgment from the steps that shouldn't need it. Controls then make the result usable by tying sensors, interlocks, and HMIs into a single interface that operators can trust during normal work and fault recovery.
A good integration review starts with the handoff points. Where does the operator load? Where does the machine confirm part presence? What happens on a misfeed, a jam, or a reset? If those answers are fuzzy, the station isn't ready for scale.
| Automation Tiers and Where Each One Pays Off | |||
|---|---|---|---|
| Dimension | Manual + Smart Tooling | Semi-Automated Cell | Full Automation |
| Best fit | High changeover, lower volume, tight labor skill constraints | Mixed-model work, mid-volume, repeatable critical steps | Stable, high-volume, low-variability production |
| Flexibility | Highest | High | Lowest |
| Capital burden | Lowest | Moderate | Highest |
| Validation burden | Light to moderate | Moderate to high | Highest |
| Risk profile | Operator dependency remains | Balanced risk, good ROI window | Expensive to change once installed |
Validate the design before it hardens
In GMP-aware environments, validation needs to be part of the design conversation, not a sign-off after installation. If the system can't be proven cleanly, repeatably, and safely, the line will spend too much time living in exception mode.
Industry guidance also keeps pointing to the same practical sequence, start with process mapping or value stream mapping, establish cycle time, defect, downtime, and utilization baselines, and pilot before scaling. Structured programs often show quick wins in 4–12 weeks, which is exactly why integration discipline matters early, not after the floor is already committed to the wrong layout. For broader process guidance, this manufacturing process optimization reference aligns with what works on the floor.
Engineering rule: if the fixture doesn't make the operator's best move the easiest move, the station is not finished.
That's the standard I'd hold every integrator to. Component quality helps, but integration quality decides whether the station runs every day or just passes FAT.
Piloting ROI and Managing Real-World Risk
The project usually succeeds or fails at pilot stage, not during design. A clean pilot proves the technical result, exposes operator friction, and tells you whether the economics survive contact with production reality.
Don't pilot a vague idea. Pilot one station, one shift, one measurable constraint, and one clear success criterion.
Start small and define success before hardware arrives
The best pilots are narrow enough to control and broad enough to matter. If you can't say what result you want, what data will prove it, and who owns the decision to scale, the pilot is really just a long demo.
A realistic ROI model goes beyond cycle time. Include changeover, labor dependency, scrap, energy, validation cost, and the cost of not improving, because that's where generic calculators usually cheat the answer in favor of the vendor.

The pilot also needs a live feedback rhythm. If operators fight the change, the issue is probably usability or workflow fit, not attitude.
Respect the failure rate of big transformations
The literature is blunt here. A large transformation dataset summarized in the process optimization research found that only 12% of initiatives achieved their original ambitions and only 2% fully met stated objectives, which means weak control plans and unclear targets are still the usual failure modes. That is a strong argument for disciplined piloting and tighter ownership, not for bigger promises.
What separates the winners from the rest is boring execution. They define the target, lock the control method, train the shift, and decide in advance what happens if the pilot misses.
If the pilot only proves the machine works, you've learned too little. It also has to prove the people can run it and the numbers still make sense.
That's how you keep a promising project from turning into a capital expense with no follow-through.
Monitoring, Maintenance, and Sustaining the Gains
Optimization isn't finished when the line starts running better. The hard part is keeping it there while shifts rotate, materials vary, and maintenance gets asked to do more with less.
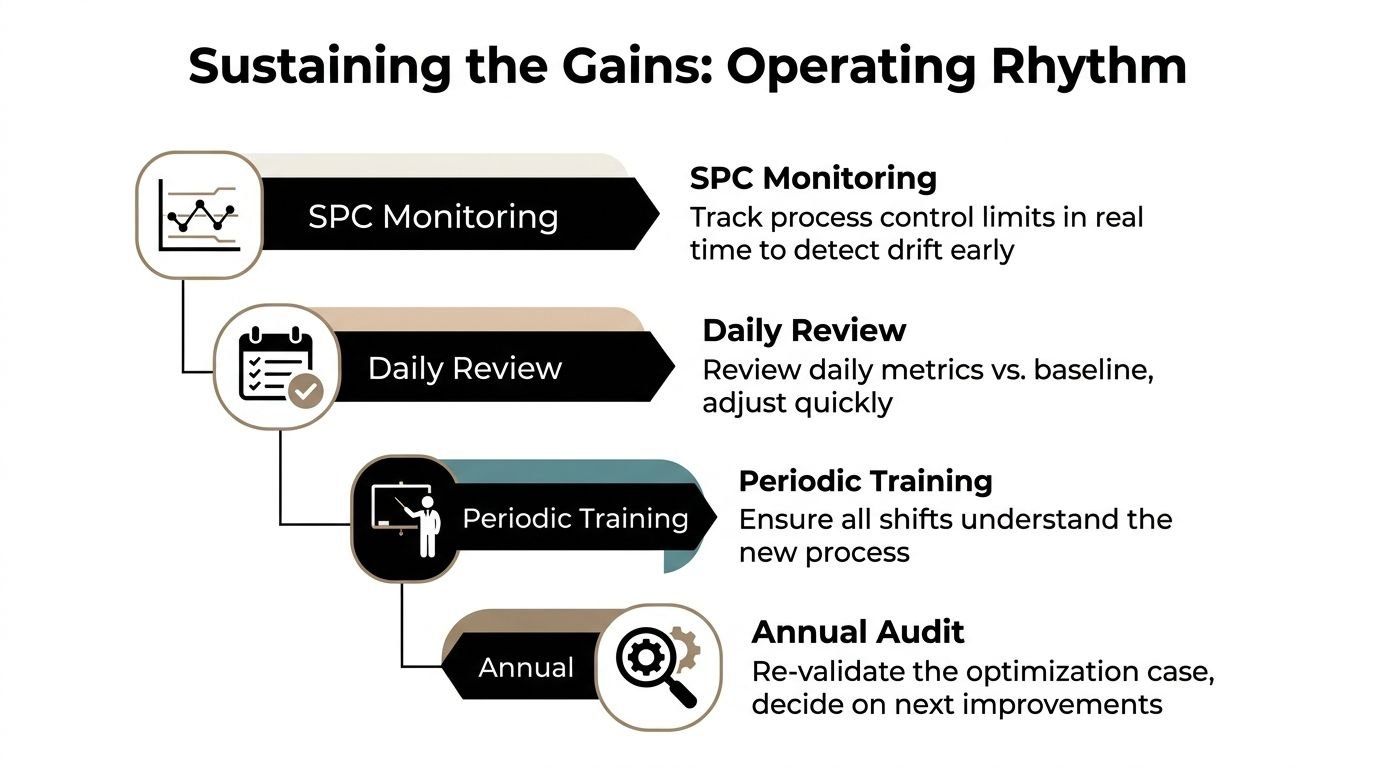
Sustainment needs an operating rhythm. That means process monitoring, maintenance discipline, and regular management review, not a one-time launch meeting that gets forgotten by the next quarter.
Keep the process under control
For quality-critical variables, SPC is the right lens because it tells you whether the process is drifting before the scrap pile grows. For equipment reliability, preventive and predictive maintenance need to replace calendar-only thinking, because failure patterns don't care what month it is.
Industry research indicates that predictive maintenance can reduce machine failure rates by 40% to 60% and lower operational disruptions and maintenance costs by 20%, which is a strong case for data-driven service rather than rigid calendar service. That sustainment logic is covered in the same automation review cited earlier, and it fits the floor better than schedule-based guesswork.
The energy dimension matters here too. If a project improves throughput but pushes energy per good part in the wrong direction, the operation may be more productive and less efficient at the same time. That's why the baseline should keep energy in view, not as a side note but as part of the operating scorecard.
Use a simple sustainment rhythm
- Daily review: Compare actual performance to the baseline, then assign one owner to each gap.
- Periodic training: Make sure every shift runs the new method the same way.
- Annual audit: Recheck whether the gains still hold and whether the next constraint has changed.
The plants that keep improving are the ones that treat optimization as a management system, not a project. The right partner also matters, because equipment delivery without ongoing support tends to leave teams with a machine they can run, but not a process they can sustain.
System Engineering & Automation helps manufacturers choose the right level of automation for the constraint in front of them, whether that means smart tooling on a manual station, a semi-automated cell, or a fully integrated line. If you're trying to recover capacity without sacrificing flexibility, visit System Engineering & Automation and talk through a practical path that fits your product mix, validation needs, and ROI reality.