

Recurring scrap is rarely just an operator problem. It usually signals process variation, weak measurement, equipment drift, design constraints, material inconsistency, or work instructions that leave too much room for interpretation. That matters for manufacturers seeking practical ways to optimize production and services, because the best scrap reduction techniques don't treat defects as isolated events. They connect data, people, equipment, materials, and engineering decisions into one operating system.
The benchmark range shows why context matters. Many plants report typical scrap rates of 2% to 8%, while startup and changeover conditions in some process-specific sectors can reach 15% to 20%. In long-product metals manufacturing, manual cut planning averages 3% to 8%, while mathematical optimization can bring scrap to 2.5% or less, according to industry scrap-rate benchmarks. The path below moves from diagnosis and measurement through prevention, process control, equipment improvement, and continuous improvement. Medical device and GMP environments require an even tighter system, including traceability, documented changes, validated processes, and controlled inspection decisions.
Table of Contents
- 1. Statistical Process Control SPC
- 2. Design for Manufacturability DFM
- 3. Preventive Maintenance and Equipment Calibration
- 4. Lean Manufacturing and Process Standardization
- 5. Root Cause Analysis and Corrective Action RCCA and CAPA
- 6. Measurement System Analysis MSA and Gauge R&R
- 7. Design of Experiments DOE and Process Optimization
- 8. Supplier Quality Management and Material Incoming Inspection
- 8-Point Scrap Reduction Techniques Comparison
- Turn Scrap Data Into a Better Production System
1. Statistical Process Control SPC
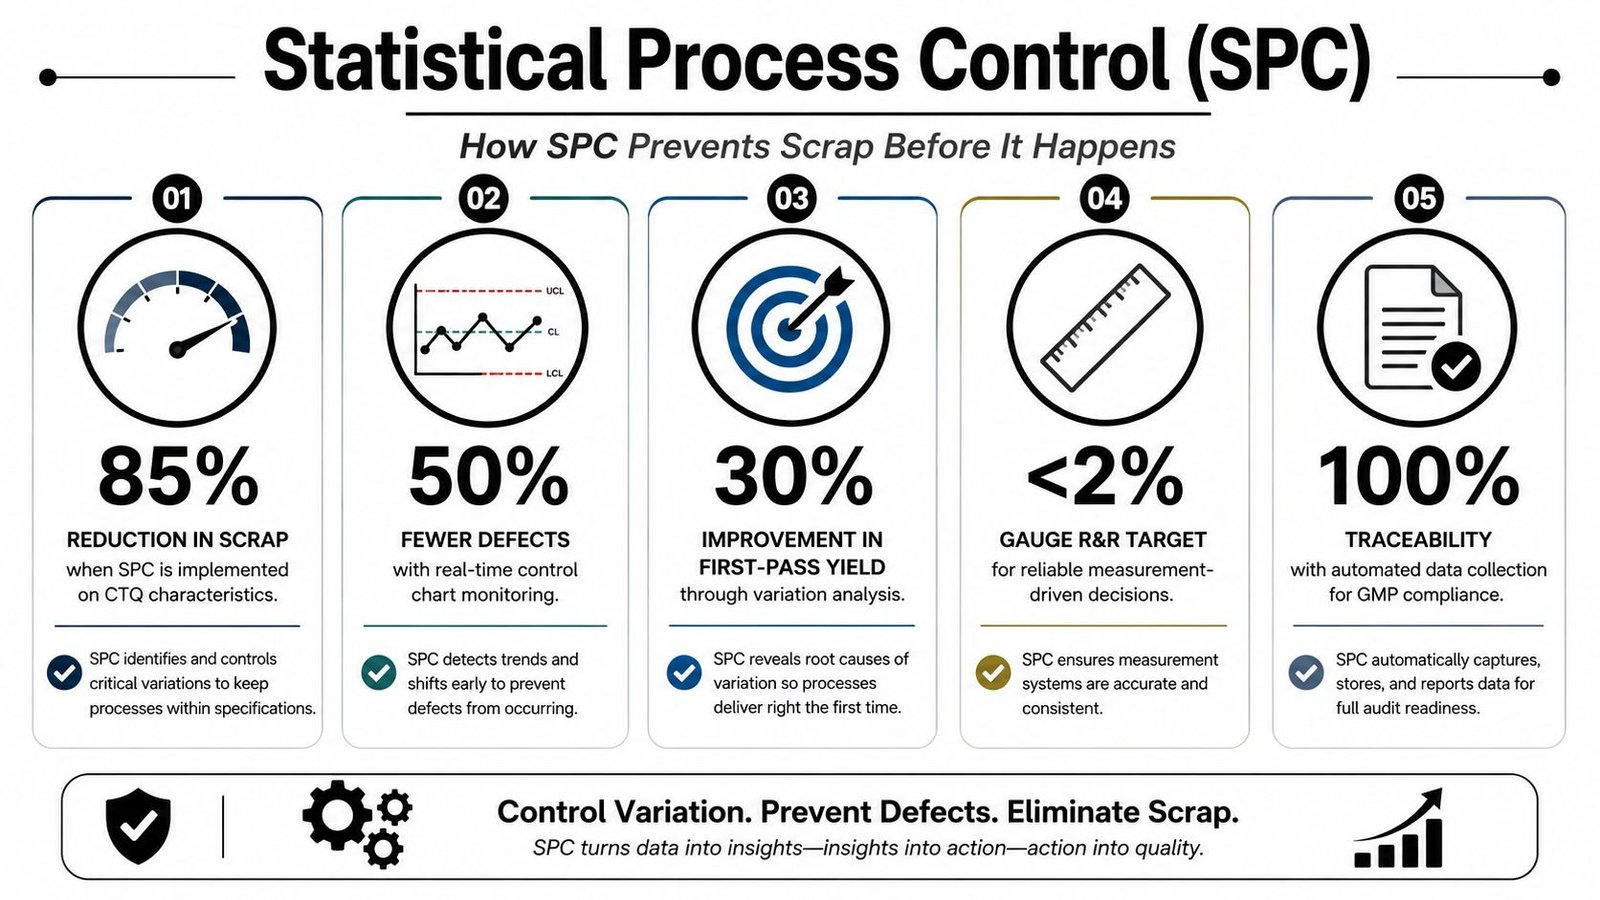
SPC reduces scrap by identifying process drift while production can still respond. It turns selected measurements into operating decisions, rather than leaving final inspection to discover a large batch of nonconforming parts. Operators and engineers monitor critical process characteristics, investigate meaningful shifts, and contain affected material before the failure mechanism spreads.
The method must match the process. An injection-molding operation may track dimensional tolerances on medical device components. A pharmaceutical packaging line can monitor fill-weight consistency, while precision machining can trend tool wear through dimensions and surface-finish results. In each case, the measured signal needs a clear connection to a defect, equipment condition, or material response.
Build SPC around critical characteristics
Do not place every available measurement on a control chart. Select critical-to-quality characteristics through risk analysis, process knowledge, and designed experimentation. The practical test is simple: can the chart support a timely production decision?
- Capture data at the source: Connect gauges, fixtures, sensors, and machine controls where feasible. This limits transcription errors and helps reconstruct when a defect began.
- Separate limits by purpose: Customer specifications define acceptance. Statistically derived control limits indicate unusual process behavior before output reaches a specification boundary.
- Define the reaction plan: State what the operator checks, which material is quarantined, and when quality, engineering, or maintenance must be called. The plan should also specify whether production continues under controlled conditions.
- Match equipment to risk: Manual collection can suit low-volume, stable work. Semi-automatic capture improves repeatability in higher-mix operations, while automated monitoring may justify its cost on repetitive or high-risk lines.
- Review changes formally: Recalculate or revise control limits only after process improvement, with documented justification. Medical device and GMP production also requires traceable records, controlled changes, and validated use of the system.
A control chart without a reaction plan is a report. It does not reduce scrap until someone knows what action to take.
Data quality determines SPC's value. Manufacturing data analytics can connect inspection results, process parameters, and production records, helping teams evaluate containment effort, recurring causes, and the return on monitoring investment. In regulated production, preserve auditability and change control instead of adding an unverified dashboard operators cannot trust.
2. Design for Manufacturability DFM
Design for Manufacturability, or DFM, reduces scrap before tooling, fixtures, and work instructions make a poor design expensive to change. A part may meet drawing requirements yet remain difficult to mold, machine, assemble, or inspect.
A useful DFM review starts with the product and the planned production system together. Design, manufacturing, quality, and service personnel should review concepts and prototypes before process validation. A medical device OEM might reduce surgical-instrument assembly steps and align tolerances with equipment that can produce them consistently. An automotive supplier may remove an undercut from a plastic housing to avoid post-molding trimming. An electronics manufacturer might standardize component placement so one semi-automatic fixture handles several products with fewer misloads.
Match design decisions to production economics
DFM does not mean full automation. In a high-mix job shop, quick-change tooling and guided manual assembly may cost less and provide more flexibility than a rigid automated cell. A repetitive medical device operation may justify custom fixtures, verification sensors, and controlled handling because an assembly error can trigger investigation, rework, and GMP documentation.
Review each design against four practical questions:
- What can the process hold? Document achievable tolerances, material behavior, tooling access, handling limits, and inspection capability.
- Which features create failure risk? Use FMEA to examine burrs, misalignment, trapped material, difficult inspection, and unnecessary handling.
- What has already worked? Reuse proven features, fixture interfaces, fasteners, and assembly sequences instead of creating avoidable process variation.
- Where will cost move? A design that lowers scrap but complicates tool changes, maintenance, or service can reduce one loss while increasing another.
The best equipment choice follows the risk and volume. Manual methods can suit stable, low-volume work. Semi-automatic fixtures improve repeatability in mixed production. Fully automated handling makes sense when cycle volume, defect consequences, and verification needs support the investment.
Early DFM changes protect launch timing and ROI. Document design decisions, risk controls, and approved changes so GMP-aware products remain traceable through validation and production.
3. Preventive Maintenance and Equipment Calibration
Scrap prevention starts before equipment failure. Tool wear, fixture misalignment, unstable temperature control, worn seals, and inaccurate sensors can shift a process outside its reliable operating window while the machine continues running.
Start with the failure mechanism and its quality consequence. A medical device manufacturer may verify gauges daily before using precision instruments for injection-molding quality control. A machining operation may check CNC tool offsets at planned intervals to limit dimensional drift. A packaging line may inspect fixture alignment when label misapplication leads to rejection. These controls protect material yield, labor capacity, and, in GMP environments, the records needed to explain and control process changes.
Link equipment condition to production decisions
Maintenance performance should include conforming output, not only uptime. A machine that runs continuously while producing nonconforming parts consumes material and labor without creating usable capacity.
Build decisions around four questions:
- How much risk does the asset carry? Set service frequency according to equipment criticality, production volume, failure history, and defect consequences.
- Which signals show developing wear? Use vibration, temperature, cycle behavior, pressure, or performance trends when they can trigger a defined response.
- What can operators detect early? Train them to report unusual noise, resistance, heat, leakage, misalignment, and repeated adjustment.
- Can the record support action? Log maintenance, calibration, part changes, and verification results so investigations and regulated documentation have traceable evidence.
Predictive monitoring only earns its cost when an alert leads to inspection, adjustment, planned replacement, or another defined action. Teams evaluating how to implement predictive maintenance should compare sensor and software costs with repeated defects, downtime, containment, and investigation effort. Manual checks may suit low-volume, stable equipment. Semi-automatic monitoring can improve response in mixed production, while fully automated monitoring requires enough risk, volume, and verification value to support the investment.

Calibration requires its own control. An inaccurate gauge, fixture, die, sensor, or measuring instrument can lead technicians to adjust a stable process incorrectly or accept parts that should be rejected. Keep calibration status, reference standards, results, and out-of-tolerance assessments traceable, particularly where medical device validation and GMP documentation apply.
4. Lean Manufacturing and Process Standardization
Lean manufacturing reduces scrap when it changes how work is designed, performed, and controlled across the production system. Standardized work provides the reference point for separating normal variation from a process change that needs action. It also connects scrap data with throughput, operator flexibility, safety, and cost, rather than treating each defect as an isolated quality event.
The historical shift toward systematic waste elimination accelerated with the rise of lean manufacturing in the 1980s. Toyota's Production System helped move industry expectations away from older “acceptable” scrap levels of roughly 8% to 15% that had been common in the mid-20th century, as described in this history of reducing manufacturing plant waste. The lasting lesson is the operating discipline: measure losses by production percentage, defect code, and process step, then use Pareto analysis and root-cause work to select controls.
Build standards around the real failure mechanism
A medical device assembly line may use visual instructions and a standardized fixture setup to prevent orientation or handling errors. An injection-molding facility can define mold installation, parameter verification, and first-piece approval to limit setup-related scrap. A smaller manufacturer may use 5S and Kaizen to reduce unnecessary handling that damages parts.
A usable standard answers four practical questions:
- What is the sequence? Show order, orientation, handling method, and verification point.
- What passes? Use visual samples, limits, and controlled references instead of vague wording.
- What happens after an abnormality? Let operators stop, contain, and escalate when conditions change.
- How is the standard controlled? Revise it after approved improvements, equipment changes, or corrective actions, and verify that compliance affects the targeted scrap source.
For medical devices and GMP-regulated production, controlled revisions, training records, approval status, and retained evidence must match the validated process. The same discipline prevents informal workarounds from becoming hidden sources of variation.
Lean fails when documentation replaces observation. Start with the highest-cost or most frequent scrap mechanism, write the standard with operators, and make the correct condition visible at the workstation. Manual controls may fit stable, low-volume work. Semi-automatic fixtures can improve repeatability without removing useful operator judgment, while full automation requires enough volume, risk reduction, and verification value to justify its capital and maintenance burden. A broader lean manufacturing process improvement program should connect these choices to throughput, flexibility, safety, and expected ROI.
5. Root Cause Analysis and Corrective Action RCCA and CAPA
Scrap codes describe the defect. Root Cause Analysis and Corrective Action, managed through RCCA or CAPA, identifies the process conditions that produced it and establishes controls to prevent recurrence.
A Lean Six Sigma case recorded 1,216 scrapped pieces out of 7,082, involving burrs, incomplete parts, missing inserts, and contamination. The reported 17.2% scrap rate matters, but the categorization matters more. Grouping defects by failure mechanism helps the team target the largest source instead of applying broad countermeasures. The figures appear in this Lean Six Sigma case study.
Build the investigation around evidence
Start RCCA while samples, machine conditions, and personnel records are still available. A medical device manufacturer investigating dimensional scrap in molded components might find that insufficient cavity cooling resulted from a miscalibrated temperature controller. An automotive supplier could use the 5 Whys to trace welding defects to inadequate training on a new semi-automated fixture. In pharmaceutical packaging, fault tree analysis may connect label misapplication with sensor calibration and alignment.
The investigation should connect each suspected cause to a check:
- Contain the issue: Identify affected material, preserve samples, and stop suspect parts from advancing.
- Record conditions: Capture machine settings, material lots, operators, shift, tooling state, alarms, and inspection results.
- Test hypotheses: Compare production data, SPC charts, equipment logs, and controlled checks rather than relying on assumptions.
- Separate causes: Distinguish the direct cause from contributing conditions, detection gaps, and management-system weaknesses.
- Verify effectiveness: Confirm that the action changes the failure mechanism without creating a new quality, capacity, or flexibility problem.
The corrective action must match the equipment and the risk. A manual check may suit a low-volume process with stable variation. A semi-automatic interlock can prevent a missed insert while retaining operator loading. Fully automated detection or rejection can reduce repetitive escapes, but its cost, maintenance, validation, and false-reject risk must justify the expected scrap reduction.
Medical device and GMP production require controlled records, traceability, appropriate review, and evidence that the approved action works in the validated process. CAPA closure should therefore rely on measured performance, not completion of a task list.
Team-based problem solving can produce measurable financial results. One manufacturing case reported monthly hard savings of $2,060.49 and soft savings of $1,837.67 after Small Group Activities were implemented, according to this scrap-reduction case record. The practical lesson is clear: value can come from a focused countermeasure rather than a major automation project, provided the defect is verified and the improvement remains effective.
6. Measurement System Analysis MSA and Gauge R&R
Scrap decisions are only as reliable as the measurement system behind them. A poor system can pass defective parts into later operations, or reject conforming parts and create avoidable material loss, rework, and production disputes.
Measurement System Analysis, including Gauge Repeatability and Reproducibility, separates variation from the equipment, method, and operators. Repeatability examines results from the device and procedure. Reproducibility examines differences between operators. Fixture design, resolution, calibration, environmental conditions, and part presentation can influence both.
Start with characteristics tied to safety, function, regulatory acceptance, or customer requirements. In precision machining, operator positioning may drive variation in coordinate-measuring-machine results. A fixture-mounted gauge can control that source without requiring a fully automated inspection cell. In injection molding, validate whether an in-line sensor detects wall-thickness variation consistently before allowing it to adjust the process automatically.
The planned guidance for critical measurements is a Gauge R&R result below 10%. Results from 10% to 30% generally require mitigation, such as better fixturing, operator training, higher resolution, or equipment upgrades. Apply these thresholds within the manufacturer's quality system and measurement context. They support engineering judgment rather than replace it.
A useful MSA review should answer five questions:
- Which CTQs matter most? Prioritize measurements connected to safety, function, regulatory acceptance, or customer requirements.
- Do the parts represent production? Include the expected range of variation and the actual production method.
- Where does operator variation enter? Observe clamping force, cleaning, orientation, positioning, and result interpretation.
- Can the system support the control decision? Automation can repeat an unreliable measurement faster, but it cannot correct poor accuracy.
- What changed afterward? Reverify following calibration, maintenance, fixture changes, software updates, or environmental shifts.

Semi-automatic equipment often provides the practical balance between control and investment. A guided fixture with a digital gauge can reduce operator-dependent variation while retaining manual loading. Fully automated inspection may suit higher volume or repetitive detection, but its cost, maintenance, validation, and false-reject risk must support the expected scrap reduction.
For medical device and GMP production, retain the study, calibration status, software controls, traceability, and approval records. The measurement system must produce evidence that quality decisions remain controlled in the approved process.
7. Design of Experiments DOE and Process Optimization
Design of Experiments, or DOE, reduces scrap by testing process factors in a planned sequence instead of changing one setting at a time. Single-factor trials can miss interactions, consume production time, and leave engineers without a dependable operating range. DOE links process inputs to a measurable failure mechanism and shows which combinations create acceptable output.
In injection molding, cavity pressure, hold time, and cooling time may jointly affect dimensions, warpage, or incomplete filling. A DOE can show whether one factor dominates, whether factors interact, and how much margin remains when material or equipment conditions vary. The same approach applies to medical device assembly, where fixture geometry, clamp pressure, and operator sequence may interact, and to precision machining, where spindle speed, feed rate, and coolant concentration influence tool wear and surface finish.
Optimize for a stable operating window
The target is a stable operating range, not the setting with the fewest defects during a controlled trial. The selected range must work with production materials, actual operators, normal environmental conditions, tooling limits, and the chosen equipment level.
Start by defining the response. Scrap, first-pass yield, dimensional performance, cycle time, and critical product characteristics can connect the experiment to production goals. Select factors with a credible link to the failure mechanism, then limit the trial to the variables the team can control. Run it during planned downtime, on pilot equipment, or with controlled quantities when possible, while preserving representative material, tooling, temperature, and operator practices.
After the trial, confirm the result under normal production conditions. Document approved parameters and use SPC to detect drift. For medical device and GMP production, retain the protocol, raw data, analysis, approval records, and change-control evidence. DOE may support a manual process, a guided semi-automatic station, or a fully automated cell, but automation should follow parameter stability, not substitute for it.
A chocolate manufacturing study reported scrap falling from 30 kg to 2.5 kg after machinery settings were corrected using predictive analytics. This predictive analytics manufacturing study illustrates how equipment setup can drive waste that might otherwise be attributed to operators.
DOE improves ROI by reducing trial-and-error, shortening engineering cycles, and preventing automation from being built around unstable settings. It can also show that better tooling, cooling, fixturing, or environmental control should come first. The right choice may be manual adjustment for low volume, semi-automatic control for repeatability at moderate volume, or full automation when volume and defect cost justify validation, maintenance, and false-reject risk.
A useful introduction to the method is available in this process optimization video:
8. Supplier Quality Management and Material Incoming Inspection
Incoming material can create scrap before production starts. Resin variation, dimensional inconsistency, contamination, incorrect components, and damaged packaging may force rejection after labor and machine time have already been spent.
Supplier Quality Management controls these failure mechanisms at their source. The system should connect supplier qualification, risk-based receiving inspection, performance monitoring, quality agreements, and corrective action. For medical devices, critical components may require automated gauges or fixture-based inspection. An injection-molding supplier might work with a resin vendor to investigate color or viscosity variation, while an assembly manufacturer can use scorecards and performance reviews to address recurring defects.
Match inspection effort to risk
Inspecting every item can slow receiving, increase labor, and still miss defects when the inspection method lacks capability. Sampling may suit lower-risk materials. Critical components may require 100% inspection or a validated automated check. Set the inspection level using product risk, supplier history, detectability, process capability, and the consequences of failure.
Build the receiving process around five controls:
- Risk-ranked suppliers: Prioritize critical materials and vendors with repeated defects or inconsistent delivery.
- Objective criteria: Specify measurable dimensions, material properties, labeling, packaging condition, and required documentation.
- Controlled acceptance: Record each decision, maintain traceability, and link results to the material lot.
- Fast escalation: Quarantine suspect material and notify the supplier before release to production.
- Joint problem solving: Share evidence and require corrective action that addresses the supplier's process, not only the shipment.
Incoming inspection should expose supplier problems, not permanently compensate for them. Repeated defects may justify an audit, process review, revised specification, containment plan, or sourcing decision. GMP-aware operations also require documented supplier approval, change notification, and traceability. These controls add administrative work, but they reduce the risk of releasing nonconforming material and support audit readiness.
Automation fits repetitive defects with clear acceptance criteria. A fixture-mounted gauge, vision check, barcode verification, or guided receiving station can improve consistency over manual inspection. Start with manual inspection when volume is low or criteria are still being refined. Use semi-automatic equipment when repeatability matters but product mix remains variable. Choose full automation only after the measurement system, data handling, and reaction plan are proven, because false rejects, maintenance, and validation can erase the expected ROI.
8-Point Scrap Reduction Techniques Comparison
| Method | 🔄 Implementation complexity | ⚡ Resource requirements | 📊 Expected outcomes | ⭐ Ideal use cases | 💡 Key advantages & practical tip |
|---|---|---|---|---|---|
| Statistical Process Control (SPC) | Moderate→High (setup of charts & data systems) | Sensors, data collection, analysts, operator training | Early detection of drift; lower scrap; improved Cpk/throughput | CTQ characteristics; medical devices; high-volume lines | ⭐ Catches drift before scrap. 💡 Automate data capture and train operators on control charts. |
| Design for Manufacturability (DFM) | Moderate (front-loaded cross-functional work) | Design engineers, prototypes, cross-functional review time | Fewer design-related rejects; faster ramp-up; lower tooling rework | New product launches; complex geometries; automation enablement | ⭐ Prevents scrap by design. 💡 Involve manufacturing early and use FMEA. |
| Preventive Maintenance & Calibration | Low→Moderate (scheduling discipline required) | Technicians, spare parts, calibration services, downtime windows | Eliminates equipment-induced scrap; improved uptime and measurement accuracy | Equipment-intensive processes; aging assets; regulated environments | ⭐ Reduces unexpected scrap and downtime. 💡 Use predictive indicators to optimize intervals. |
| Lean Manufacturing & Process Standardization | High (culture change and sustained effort) | Training, facilitators, operator time, visual tools | Reduced operator error and variation; visible quality issues; continuous improvement | Manual assembly, high WIP, processes needing standard work | ⭐ Engages teams to reduce waste. 💡 Start with highest-scrap processes and involve operators in standards. |
| Root Cause Analysis & CAPA (RCCA/CAPA) | Moderate→High (structured, time-consuming investigations) | Cross-functional teams, data collection, skilled facilitators | Prevents recurrence of defects; documented corrective actions; audit-ready evidence | Recurring or complex defects; regulatory investigations | ⭐ Eliminates root causes long-term. 💡 Act quickly, use data to validate hypotheses. |
| Measurement System Analysis & Gauge R&R (MSA) | Moderate (statistical studies and re-verification) | Gauges, statisticians, time for studies and recalibration | Fewer false accepts/rejects; trusted inspection data; supports SPC | Critical measurements; pre-automation verification; CTQs | ⭐ Ensures measurement reliability. 💡 Run Gauge R&R before major process or equipment changes. |
| Design of Experiments (DOE) & Process Optimization | High (statistical design + dedicated run time) | DOE software, production/pilot time, statistical expertise | Optimized parameter windows; reduced scrap; identifies interactions | Multivariable processes (molding, machining); process development | ⭐ Rapidly finds optimal settings. 💡 Match experiment conditions to real production and confirm with runs. |
| Supplier Quality Management & Incoming Inspection | Moderate (ongoing supplier oversight) | Inspection equipment, QA staff, audits, supplier data systems | Fewer supplier-origin defects; improved supplier performance; traceability | Critical incoming components; high-risk suppliers; regulated supply chains | ⭐ Prevents scrap at source. 💡 Risk-rank suppliers and define objective acceptance criteria. |
Turn Scrap Data Into a Better Production System
Scrap reduction works best when a manufacturer treats every defect as evidence about the production system. Start with the source that costs the most or occurs most often, then verify that the measurement system can distinguish a real defect from measurement variation. Document the root cause with production evidence, select a corrective action that addresses the failure mechanism, and confirm that the improvement remains effective after normal shifts, material changes, maintenance, and changeovers.
A useful baseline should include more than scrap rate. Track first-pass yield, rework, downtime, material cost, defect category, process step, machine, shift, and lot. Compare the cost of the loss with the cost of the intervention, including installation, validation, training, maintenance, inspection, and lost flexibility during changeover. Equipment price alone isn't an ROI calculation.
Benchmark context can help set a direction without creating unrealistic targets. Recent manufacturing benchmarks report scrap rates of 1.5% to 3.0% for automotive components, 2% to 5% for aerospace machining, 0.3% to 1.5% for electronics assembly, 3% to 6% for metal fabrication, 1% to 3% for plastics molding, 2% to 4% for precision machining, and 4% to 8% for foundry and casting. The same manufacturing scrap-rate reduction guidance places world-class targets below 0.5% to 3%, depending on the process, with below 1% often considered strong performance in discrete manufacturing and above 5% commonly indicating a systemic quality or process issue. Use these figures as context, not as a promise that every line should achieve the same result.
Evidence also shows that measurement and focused action can outperform broad, unfocused programs. Independent operational guidance reports that plants moving from manual scrap counting to automatic capture achieved a 25% to 40% reduction in measured scrap within 12 months, with most improvement coming from fixing the top two or three defect reasons. The same guidance recommends stratifying scrap by defect type, machine, shift, and lot, then combining Pareto analysis, root-cause methods, preventive maintenance, poka-yoke, and first-article checks, as outlined in this automatic scrap-capture guidance.
The next decision is the right level of equipment. Manual methods may remain the best choice for low volume, high mix, or frequent changeovers. Semi-automatic systems can add guided loading, error proofing, inspection, fixtures, and integrated controls while preserving flexibility. Full automation can make sense when the product, volume, process capability, and maintenance resources justify it. In medical device and GMP environments, the choice must also account for validation, documented changes, controlled software, traceability, and operator authority to stop the process.
SEA helps manufacturers evaluate those trade-offs through custom tooling, fixtures, integrated controls, semi-automation, fully automated equipment, and manual solutions. System Engineering & Automation can support projects from early consultation and preliminary concepts through design, manufacturing drawings, material sourcing, installation, and commissioning, with GMP-aware practices and ongoing maintenance support. The right solution may be a smart fixture at one workstation, a controlled semi-automated cell, or a broader engineering program tied to production goals, budget, flexibility, and payback.
System Engineering & Automation offers custom tooling, fixtures, integrated controls, and semi-automatic systems designed to reduce variation and improve production quality without sacrificing practical flexibility. Visit System Engineering & Automation to discuss your scrap source, equipment constraints, and the level of automation that fits your manufacturing goals.