
More than 40% of industrial organizations in McKinsey's analysis of automation in industrials describe their automation efforts as successful or very successful. Only 4% report significant bottom-line improvement. The gap opens before a single machine runs, in the spreadsheets where projects get approved: someone counts the labor hours the system should remove, multiplies by a wage rate, and stops measuring.
A case built that way can't be defended at month nine, when throughput is up, headcount is unchanged, and nobody can say whether the investment is winning. The problem isn't the formula. It's how few things the formula counts.
What follows is the full measurement kit: the twelve metrics that belong in an automation business case, a five-step method for baselining and validating them, a worked example with the arithmetic shown, external benchmarks for sanity-checking a forecast, GMP-aware metrics for validated medical device production, and the stage gates that keep a business case honest after the purchase order.
Table of Contents
- Automation ROI Metrics That Matter Most
- How to Measure Automation ROI Step by Step
- A Worked ROI Example for a Semi-Automated Cell
- Benchmarks for Automation Payback and Productivity
- Why Labor Savings Alone Understate Automation ROI
- GMP-Aware ROI Metrics for Medical Device Automation
- Turn Your Metrics into a Phased Automation Business Case
Automation ROI Metrics That Matter Most
Every automation project starts with a labor number and gets judged on it a year later. That number drifts the moment the cell meets real demand, real product mix and a learning curve, so a case that looked decisive at approval can look marginal by the second quarter.
The scorecard below covers twelve metrics across financial return, throughput, quality, asset performance and compliance. Take all twelve into the project charter, then narrow to five to seven tied to the bottleneck you're automating. A cell built to relieve a manual press doesn't need changeover time in its top set. A high-mix cell with six product families does.
| Metric | How to calculate | What good looks like |
|---|---|---|
| Simple ROI | Cumulative net benefit ÷ total investment | Positive by month 18 to 24, and reported at 12, 18 and 24 months rather than as one point |
| Payback period | Total investment ÷ average monthly net benefit | Under 24 months on conservative volumes, with ramp-up months modeled explicitly rather than assumed away |
| Annual net benefit | Incremental contribution margin + verified avoided costs − incremental operating costs | Positive and stable after ramp-up, with the launch period shown on its own line |
| Units per labor hour | Good units produced ÷ total labor hours | Rising against the validated baseline, compared at constant product mix |
| First-pass yield | Units passing all checks first time ÷ units started | Rising, with fewer rework loops and a shorter rework queue |
| Scrap and rework cost | (Scrapped units × unit cost) + (rework hours × fully loaded rate) | Falling as a share of revenue, not just falling in absolute dollars |
| Cycle time | Process time per unit at the constraint | Shorter and more consistent, with a narrower spread between the fastest and slowest cycles |
| Equipment availability | Run time ÷ planned production time | Rising toward the plant target and stable after ramp-up |
| Cost per good unit | Total period production cost ÷ good units | Falling against baseline at constant product mix |
| Changeover time | Average minutes lost per product changeover | Falling, which supports smaller batches and mix flexibility |
| Safety and ergonomic incidents | Recordable incidents plus near misses per period | Falling, with fewer manual-handling and repetitive-motion tasks |
| Quality deviations and CAPA load | Deviations, nonconformances and open CAPAs per period | Falling investigation hours and fewer repeat findings |
How to Read the Scorecard
- Lock definitions before launch. Decide what counts as a good unit, when the cycle clock starts, and whether rework hours count as labor hours. Ambiguity here is what lets two departments report different ROI numbers for the same cell.
- Keep the set unchanged for at least twelve months. Adding a metric mid-year resets the comparison and invites a flattering narrative.
- Name a baseline owner for every row. A metric with no owner becomes a slide.
- Separate the two data worlds. Simple ROI, payback and net benefit come from the business-case model. Units per labor hour, first-pass yield, scrap cost, cycle time, availability, cost per good unit and deviation load come from daily production systems: MES and ERP records, scrap reports, quality records and time studies.
Practical rule: If nobody can produce last quarter's value for a metric, it isn't a baseline. It's a wish.
Where the automated cell sits upstream or downstream of the plant constraint, add plant-level throughput to the set and test it against the throughput optimization plan the project is meant to serve. A cell that hits its own targets while the constraint moves somewhere else hasn't paid back anything yet.
How to Measure Automation ROI Step by Step
A simple model built on measured data beats a complex model built on a guess. NIST's guidance for automation business cases makes the same point procedurally: estimate return explicitly before the project, track forecast error formally, recalibrate as evidence arrives, and tie every benefit to a financial result through a validated before-and-after method (NIST automation ROI guidance).
The sequence below turns that guidance into five steps, each with one deliverable you can put in front of a plant manager.
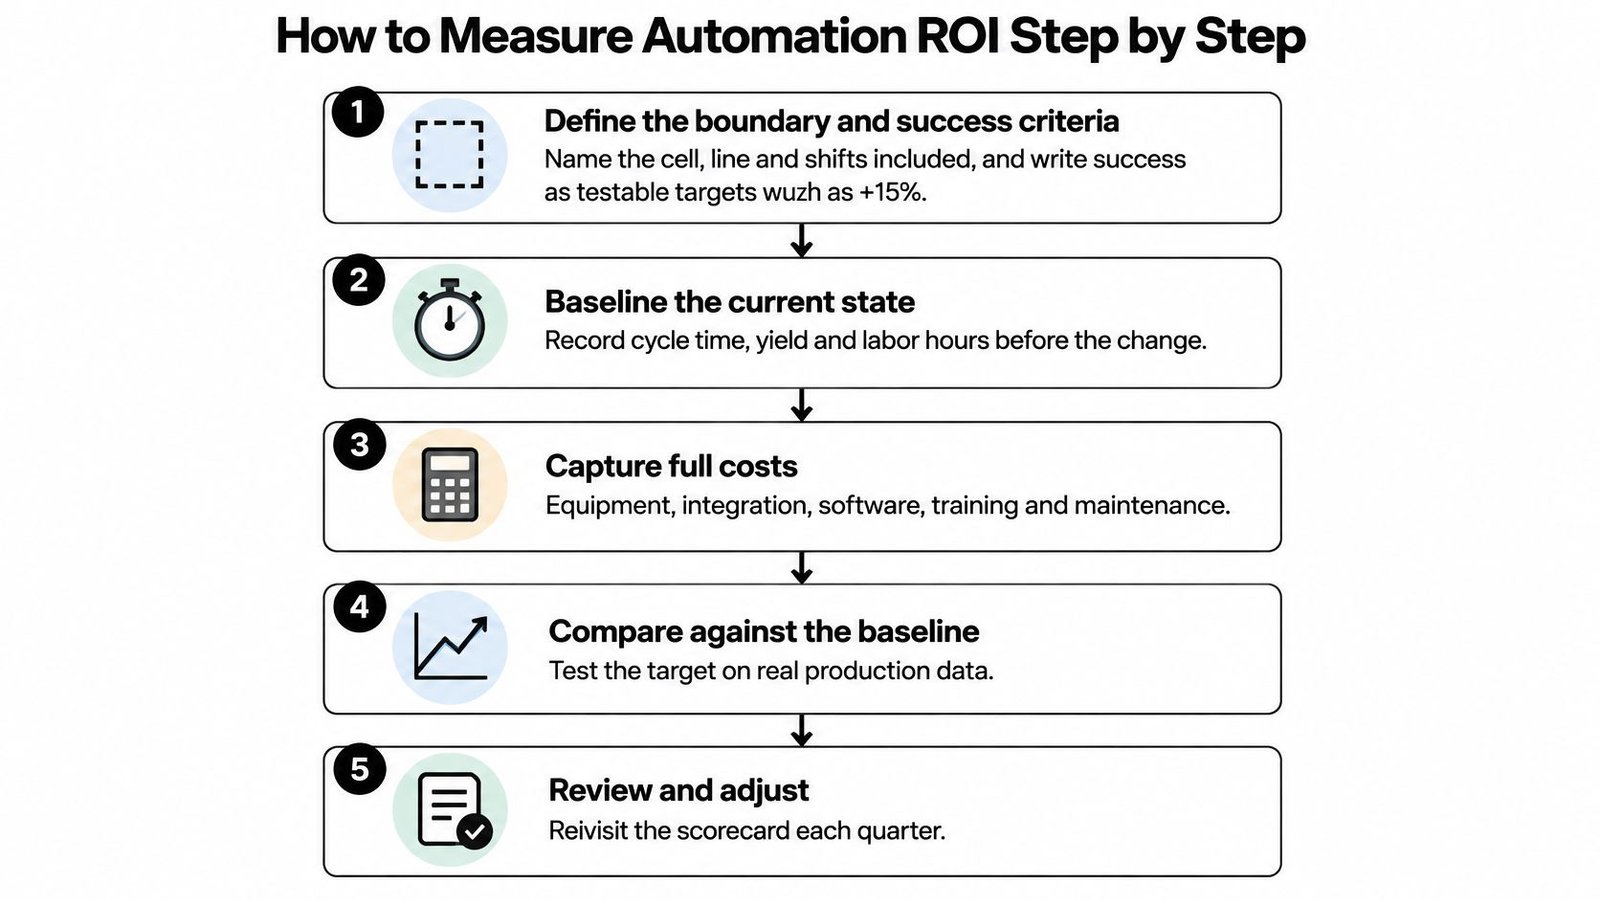
- Define the boundary and the success test. Name the cell, line, shifts, part numbers and operations inside the fence, and state what's outside it. Then write success as something a test can settle: +15% throughput at equal or better first-pass yield, or cost per good unit down 8% at constant mix. Deliverable: a one-page scope note with those targets dated.
- Baseline two to four normal weeks. Normal means no launch, no inventory push, no skeleton crew. Record labor hours per unit, cycle time and its spread, throughput, first-pass yield, scrap and rework, downtime, maintenance spend, safety incidents, training hours and quality costs. Pull them from MES or ERP records, scrap reports and a stopwatch study run by someone who will still be on the floor next year. Deliverable: a baseline table with a source system and owner per row.
- Model total cost of ownership. Equipment, integration, tooling, controls, installation, commissioning, validation, operator training, maintenance, utilities, software, production lost during the build, and planned upgrades. The last two are the lines that get missed. Deliverable: a cost register where every line carries a quote or a stated confidence level.
- Calculate benefits from sellable output. Annual net benefit = incremental contribution margin + verified avoided costs − incremental operating costs. Simple ROI = cumulative net benefit ÷ total investment. Payback = investment ÷ average monthly net benefit. Book the demonstrated rate, not the nameplate rate: a cell that runs 60 units an hour at acceptance and 45 with your parts, your operators and your changeovers goes into the model at 45.
- Validate on a schedule and recalibrate. Use a control line, a matched shift or a phased rollout so demand, mix and learning-curve effects aren't credited to the machine. Compare forecast with realized at 30, 90 and 180 days, and change the model when the evidence says so.
Here's a walkthrough of the same measurement logic applied to a live project, including where the numbers typically bend:
Two habits carry the whole workflow. Book only the rate the cell demonstrates on your parts, and let a control group take the credit before the machine does. Plants that skip the second habit spend the following year arguing about attribution instead of adding the next station.
A Worked ROI Example for a Semi-Automated Cell
Here's the arithmetic on a cell the size most plants approve, with every assumption stated before the result. A precision components manufacturer has a manual assembly cell sitting on the plant bottleneck, staffed by two operators on one shift plus Saturday overtime. The investment totals $180,000: $120,000 for the semi-automated cell with robotic pick-and-place, servo pressing with torque monitoring and vision inspection, $35,000 for integration, tooling and controls, and $25,000 for installation, commissioning, validation and training.
After commissioning, throughput rises from 40 to 50 good units per hour and first-pass yield from 94% to 98.5%, with the same headcount. The cell can produce roughly 20,000 more good units a year. The plant can sell 12,000 of them, mostly business it declined last year.
| Line item | Baseline | Post-automation |
|---|---|---|
| Throughput (good units per hour) | 40 | 50 |
| First-pass yield | 94% | 98.5% |
| Scrap and rework cost | $34,000 a year | $12,000 a year |
| Overtime premium | $18,000 a year | $0 |
| Incremental good units sold | , | 12,000 a year at $8 contribution margin |
| Incremental operating cost (maintenance, utilities, software) | , | $12,000 a year |
| Total investment (equipment, integration, installation, validation) | , | $180,000 |
| Net annual benefit | , | $124,000 |
| Payback period | , | About 17.4 months |
| Simple ROI at 12 / 24 months | , | -31% / +38% |
Where the $124,000 Comes From
Twelve thousand incremental good units at an $8 contribution margin contribute $96,000. Avoided scrap and rework adds $22,000, avoided Saturday overtime adds $18,000, and $12,000 of incremental maintenance, utilities and software comes off the top. That leaves $124,000 of annual net benefit against $180,000 of investment.
Payback arrives at 180,000 ÷ 124,000, or about 17.4 months. Simple ROI at month 12 is negative at roughly -31%. Break-even lands near month 18, and cumulative ROI over 24 months reaches about +38%.
Reading the Payback Curve over 24 Months
A single payback number hides the shape of the investment, and the shape is what determines whether a project survives its first budget review. Months one to three rarely deliver mature-state benefit; if they run at 60% of it, payback slips past 19 months, which is exactly the slip that gets a good project cancelled when nobody modeled it upfront.
The demand assumption carries more weight than the engineering. The cell's extra 20,000 units of capacity are worth nothing until somebody buys them, so the case counts 12,000 contracted or confidently forecast units and treats the rest as option value. Judge a project over 24 to 36 months, and never bank capacity you can't sell.
Benchmarks for Automation Payback and Productivity
External benchmarks do two jobs: they screen opportunities before you spend engineering time, and they flag a forecast that looks too good. They never replace your own validated baseline, because product mix, utilization and validation burden move results further than equipment brand ever will.
| Benchmark | Reference value | Source context |
|---|---|---|
| Semi-automated system payback | Typically within one year | Common outcome for a well-scoped semi-automation project |
| Scrap, rework and inspection performance | Reduced scrap and rework, better inspection accuracy | Typical result once process parameters repeat identically every cycle |
| Labor productivity gain from flexible-automation assembly | +30% | NIST Manufacturers' Guide to Industry 4.0 Technologies |
| Labor efficiency gain from collaborative robotics | +25% | Same NIST guide |
| Production output gain from smart-manufacturing initiatives | 10-20% | Deloitte 2025 Smart Manufacturing Survey, 600 executives surveyed in 2024 |
| Non-hardware cost adder (integration, training, facilities, disruption) | A meaningful sum on top of the equipment price, sized project by project | Standard scoping practice; often the line that decides whether the case holds |
| Smart-manufacturing infrastructure savings potential | About 3.2% of shop-floor production costs, roughly $57.4 billion a year economy-wide | NIST estimate |
| Share of manufacturing working hours potentially automatable | 64% overall; 87% for production workers | McKinsey manufacturing automation analysis |
Nearly 80% of manufacturers reported positive outcomes from recent automation projects in a 2025 industry survey. That's a low bar with a wide distribution behind it. Positive isn't profitable, and a plant that lands mid-range on every row has still spent real capital to get there.
Read the percentage rows as ranges and screening thresholds, never targets. NIST's 3.2% estimate describes an economy-wide saving from better smart-manufacturing infrastructure, not a promised return on your next workstation, and the one-year semi-automation figure assumes a scoped project rather than a speculative one. Convert whatever benchmark you cite into a plant-specific commitment before you sign: raise units per labor hour 20% at equal or better first-pass yield within twelve months, or cut cost per good unit by a stated percentage at constant mix. Then replace the benchmark with your own baseline as soon as you have four weeks of data.
Why Labor Savings Alone Understate Automation ROI
Labor payback is the weakest lens for judging semi-automation, and it is the one most capital requests are built on. Two errors compound at once. Labor-only calculations can understate actual labor costs by 30% to 60% once benefits, payroll taxes, supervision, training and turnover are loaded into the hourly rate (manufacturing automation ROI guidance). And most semi-automated cells keep their headcount, so the labor line in the model reads zero while output climbs. A project can look dead on paper and still pay back inside a year.
Build the case on four buckets instead. They behave differently, they age differently, and finance will pressure-test each one on different grounds.
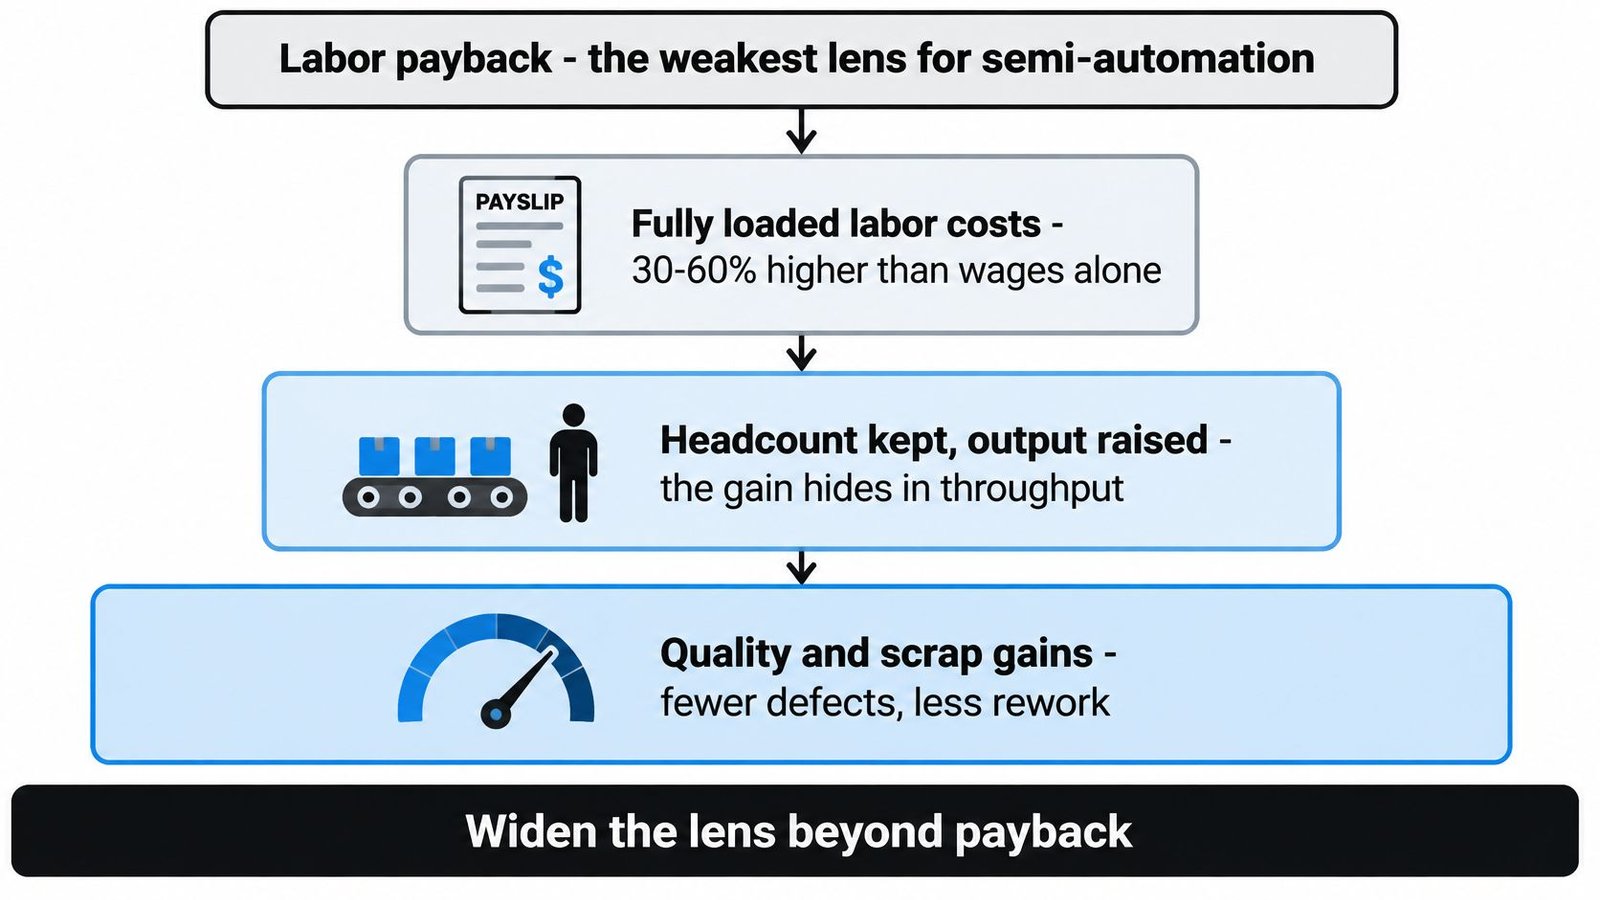
Capacity released is the easiest to misprice. The value is hours freed at the constraint multiplied by the contribution margin of units you can sell, not a headcount reduction you may never take. Run a cell that frees 400 constraint hours a year at a $75 contribution margin per machine hour and that bucket alone carries $30,000 annually.
Cost avoided covers the scrap, rework, overtime, expedited freight and warranty returns that shrink once the process repeats identically every cycle. These already sit in your cost-of-quality reporting; the automation case just assigns them an owner and an expected reduction.
Revenue enabled gets inflated most often. Count orders accepted because the cell can now produce them with confidence, and leave theoretical capacity out of the total. A quote you could not take last quarter is evidence. A sales projection is not.
Risk reduced is the quietest of the four: fewer ergonomic injuries, fewer quality escapes, stronger traceability, and less dependence on one experienced operator who is three years from retirement. I weight it last in the model and raise it first in the review meeting.
A project with a weak labor-payback case can still be the best capital decision on the list when demand, skilled labor or defect costs are the real constraint.
The plant-level pattern shows up at national scale too. An OECD review of robot adoption reported that industrial-robot adoption in Germany was associated with a GDP increase of 0.5% per person per robot between 2004 and 2014. The gains registered as productivity and a shift toward skilled roles, not as a clean subtraction of heads.
Report results three ways: per good unit, per labor hour and per constrained production hour, because annual totals hide mix and demand effects. The full cost side of that comparison belongs in the total cost of ownership model, priced before the first invoice rather than discovered after it.
GMP-Aware ROI Metrics for Medical Device Automation
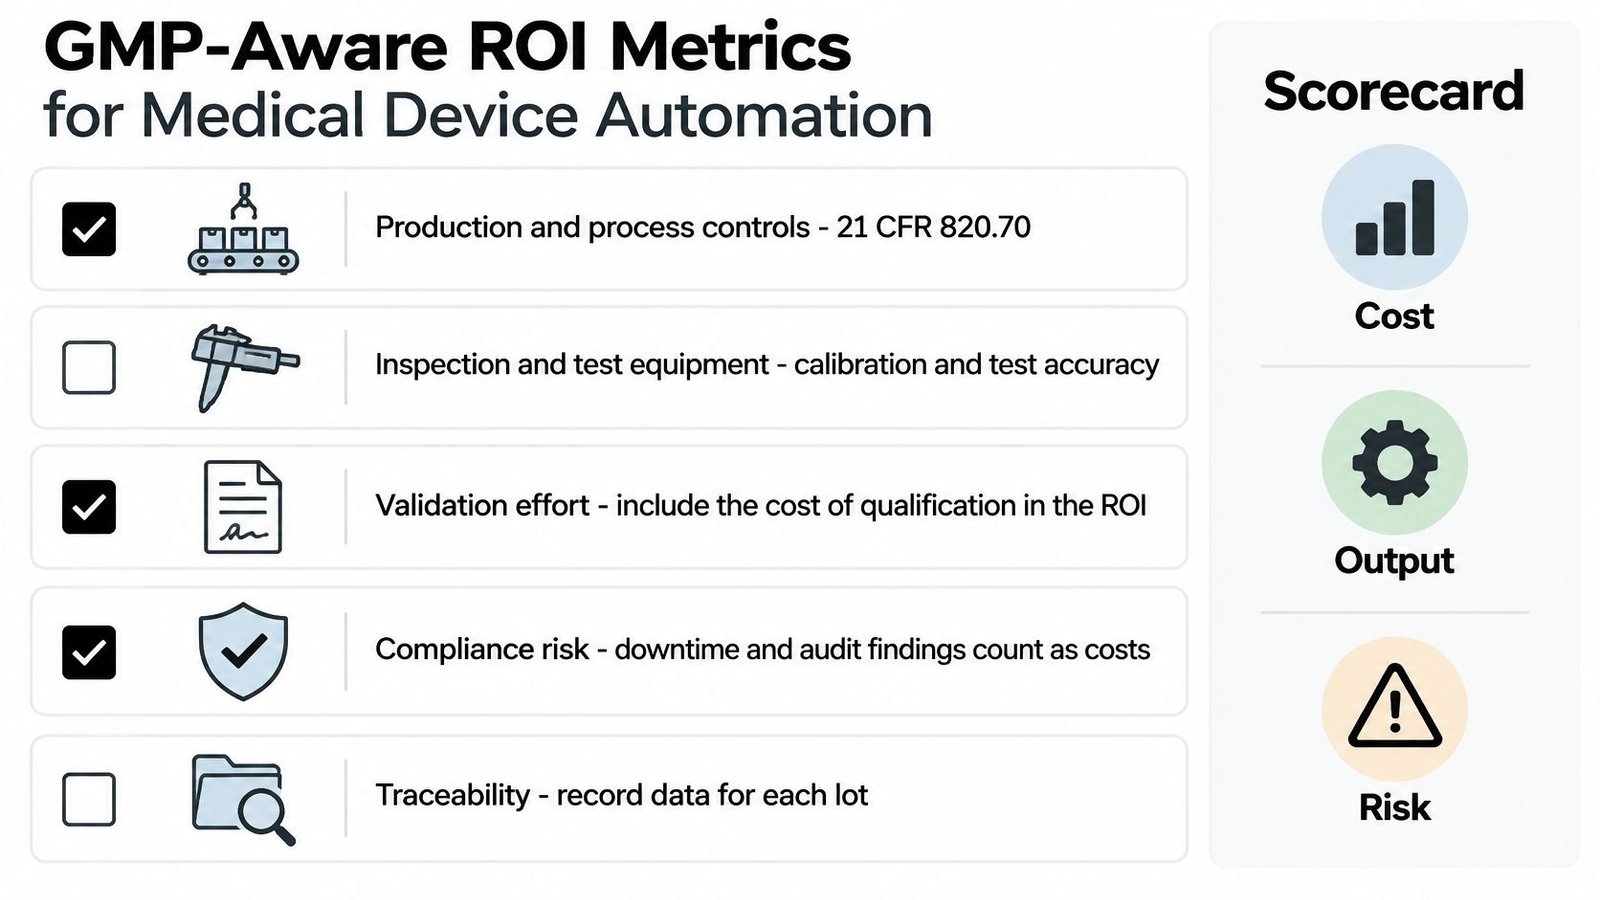
In a validated plant, the numerator of the ROI equation changes shape. FDA quality-system requirements for medical devices cover production and process controls under 21 CFR 820.70, inspection, measuring and test equipment under 820.72, process validation under 820.75, and statistical techniques under 820.250. Each one converts a line item that other industries treat as overhead into a cost you must plan, document and defend.
That means validation protocols, equipment qualification, calibration, data integrity, change control, acceptance activities, traceability and servicing belong in the original cost model. A supplier who treats qualification as a post-installation extra has mispriced the project, and the gap lands on your validation team in the busiest quarter of the year.
The GMP Scorecard Additions
- Nonconformance and deviation rate, tracked with cost per investigation so a deviation isn't just a quality event but a dollar figure.
- CAPA count and closure cycle time, because an open CAPA consumes engineering hours long after the batch ships.
- Inspection consistency across operators and shifts, measured as variation in pass rates for identical product.
- Traceability coverage, meaning the share of units with a complete device history and no manual reconstruction needed.
- Documentation error rate, which falls sharply when records are captured automatically at the point of work.
- Audit findings tied to the automated process, tracked before and after with the same definitions.
These aren't abstract exposures. In FY2017 the FDA issued 3,519 Form 483 observations citing deficiencies related to 21 CFR 820, with a 14% increase in Form 483s and a 10% increase in observations over the prior year, and production and process controls and CAPA count among the most frequently cited areas (FDA inspection data). Avoided quality costs, investigation hours and rejected product belong in the numerator, not in a footnote.
Which is why GMP in manufacturing belongs in the ROI conversation rather than only in the quality manual. In a validated environment, the highest-return automation is often the system that improves repeatability and evidence of control, even when its direct labor savings look modest on a spreadsheet. That case is harder to write and far easier to defend in an audit.
Turn Your Metrics into a Phased Automation Business Case
A measured baseline is the input. A phased case is the output, and the phasing is what keeps it survivable. Four stage gates do the work: a concept estimate at plus or minus 30% accuracy with named assumptions, a pilot measurement on a single cell, a production acceptance test against the success criteria, and benefit verification at 90 and 180 days comparing forecast with realized results.
Run three cases, low, expected and high, varying utilization, uptime, yield, labor availability and implementation duration. Those five variables move the answer more than the purchase price does, and the usual culprit is off-machine cost: a recent analysis of plant automation investments estimates integration, training, facility changes, maintenance and production disruption add 25% to 50% to the equipment price.
Gate to enforce: No project moves from pilot to full rollout without a forecast-versus-realized comparison on one cell.
Keep forecast ROI and realized ROI in separate columns of every document. A 2025 Forrester-commissioned study cited in the same analysis projected a 457% three-year ROI with up to 50% fewer defects and up to 40% fewer equipment failures, and those are scenario outcomes to test, not numbers to put in a board paper.
Traps That Kill Otherwise Good Cases
- Counting capacity you can't sell. Unsold output is inventory, not return.
- Comparing mature automated output to a tired baseline. Log launch-period performance separately so the comparison stays fair.
- Quoting one payback figure with no ramp-up. Ramp-up is where most of the variance lives.
- Mixing product mixes between periods. A richer mix flatters a cell that hasn't improved at all.
- Leaving validation, maintenance and training out of the denominator. They arrive on schedule whether or not the model anticipated them.
The One-Page Report Leaders Actually Read
Payback progress against plan sits at the top, followed by trend lines for units per labor hour, first-pass yield and scrap cost, then the deviation count and a forecast-versus-realized table refreshed at 30, 90 and 365 days. Track flexibility as its own small block: changeover cost and time, number of products the cell supports, lost production minutes per changeover, and the share of equipment reusable for future programs.
Pick the most constrained cell, run a two-to-four-week baseline with the step-two method, then bring those numbers to a conversation. We evaluate production workflows to find where automation creates the greatest impact, advise on the right level of automation (frequently semi-automatic rather than a full line), and phase projects so additional stations can be added as the business grows. In a no-obligation consultation we want your current bottlenecks, labor and production constraints, quality or consistency concerns, and budget and timeline expectations.
System Engineering & Automation builds semi-automated and fully automated systems, custom tooling, fixtures and integrated controls for manufacturers who need the ROI case to hold up after commissioning. Bring the scorecard from this article and we'll walk your constrained cell with you, from validated baseline through the 90- and 180-day benefit review. Visit System Engineering & Automation to start that conversation.