
A line can look healthy on the production board and still miss shipment because the actual constraint is somewhere nobody is watching. The obvious slow station gets the attention, while work-in-progress accumulates at an upstream buffer, operators wait for material, and downstream equipment runs below its potential. On semi-automated lines, that pattern can change by shift as product mix, changeovers, staffing, and small stoppages alter the flow.
Bottleneck identification is therefore more than finding the machine with the longest cycle time. It means locating the resource that governs total throughput, proving the diagnosis with current shop-floor evidence, and choosing an improvement that survives quality, validation, and GMP review. The practical sequence matters more than the software, dashboard, or automation concept selected at the end.
Table of Contents
- Why the Wrong Bottleneck Costs You Twice
- The Five Focusing Steps That Work on the Floor
- Measuring What Matters Without Drowning in Data
- Mapping the Flow to Expose Hidden Constraints
- Turning Bottleneck Findings into Automation Wins
- Keeping Up with the Bottleneck That Keeps Moving
Why the Wrong Bottleneck Costs You Twice
A line is reporting 65% OEE, and the production meeting starts with the same conclusion: the visibly slow station must be the bottleneck. Managers discuss a faster actuator, a redesigned fixture, or another operator. Yet three stations upstream, a buffer is full and the supposed constraint is intermittently waiting for parts.
That mistake costs twice. The first cost is direct. Capital, engineering time, and labor are applied to a station that isn't governing the line, so the investment produces little or no throughput improvement. The second cost is harder to see. While the team works on the wrong station, the actual constraint continues to starve downstream operations, extend lead times, and encourage more safety stock.
Practical rule: A busy station isn't automatically the bottleneck. The constraint is the resource whose limitation controls the output of the whole system.
The Theory of Constraints formalized this system-level view. Eliyahu M. Goldratt introduced the framework in the 1980s, defining a bottleneck or constraint as the resource that limits system throughput. ACCA's technical guidance describes the five focusing steps and emphasizes that the method addresses the system rather than optimizing isolated departments. In manufacturing, that distinction matters because a small improvement at the rate-setting resource can affect output, flow, and delivery reliability disproportionately. ACCA's technical guidance on the Theory of Constraints
Why semi-automated lines are deceptive
A fully automated line may provide clean event data, but semi-automated operations often hide the losses that move the constraint. A station can have an acceptable nominal cycle time and still lose capacity through changeovers, micro-stops, material presentation problems, or operator skill variation. One shift may keep the feeder supplied, while another experiences repeated starvation.
Utilization and queue length help, but neither should stand alone. Recent bottleneck literature highlights disagreement over definitions and the problem of bottleneck shiftiness, where the active constraint changes with operating conditions. A single metric can mislead in steady-state and transient conditions, particularly on mixed-model, manual, or partially automated systems. Research on bottleneck shiftiness and detection methods
Start with observation before intervention. Walk the line during a representative shift, record where parts wait, note when operators wait, and identify which failure stops or throttles the line. Then compare those observations with station data. The diagnostic sequence should establish the governing constraint before anyone approves a fixture, cell, or staffing change.
The Five Focusing Steps That Work on the Floor
Goldratt's five focusing steps work best as a decision loop, not as a checklist of disconnected improvements. On a semi-automated line, apply each step to the conditions of the current shift. The constraint may be a machine in one shift and material presentation or operator availability in the next.
Identify the resource setting the pace
Find the station or resource limiting total line throughput. Persistent WIP before a station, capacity close to current demand, and repeated downstream starvation are useful signals. The Theory of Constraints bottleneck identification guide explains why queue growth and limited capacity provide a practical starting point.
Verify the observation with the same time window of data. Record queue timestamps, count completed units, and compare utilization across stations. A data-driven method defines the bottleneck by the increase in system throughput produced by an isolated increase in machine throughput, expressed as ΔTHsys,i/ΔTHi. The machine with the highest ratio is the system bottleneck. The peer-reviewed data-driven bottleneck identification study
Use the capacity already available
Get more useful output from the constraint before requesting new equipment. Check whether it waits for material, performs unnecessary checks, pauses between cycles, or loses time during poorly planned changeovers. Protect the station from starvation and blockage, and keep qualified work ready whenever it can run.
A small recurring loss at the constraint can resemble a major capacity shortage. Stabilize the current method before treating capital spending as the answer.
Align the rest of the line
Every other process should support the constraint's rate. Review feeder buffers, replenishment routes, inspection timing, and downstream hand-offs. A faster upstream station that floods the buffer adds handling and congestion rather than system output.
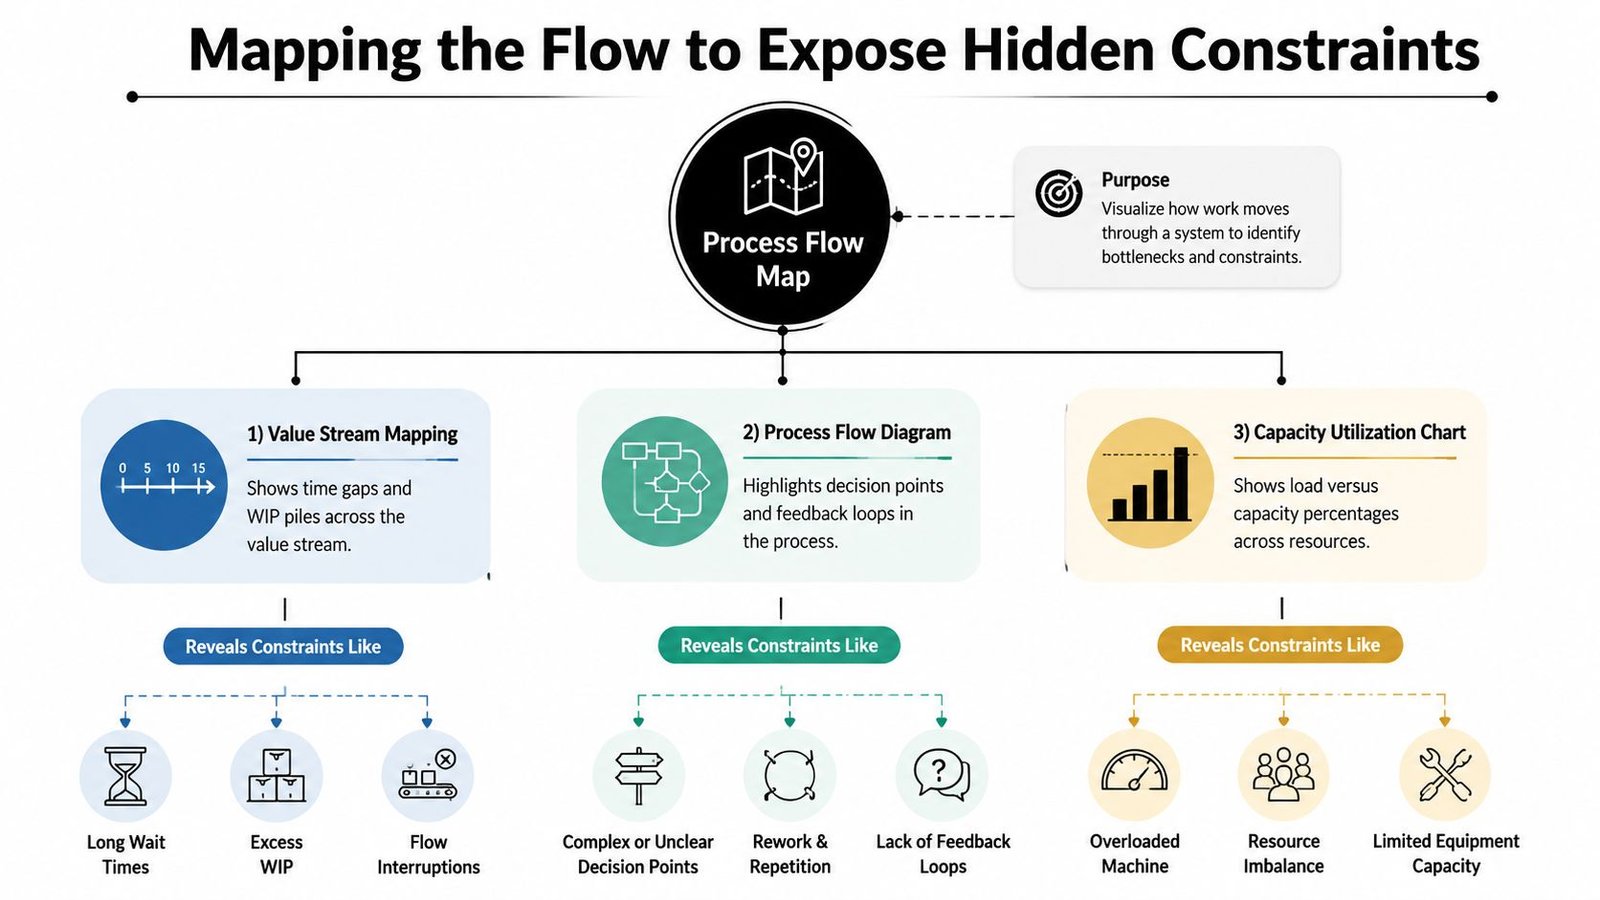
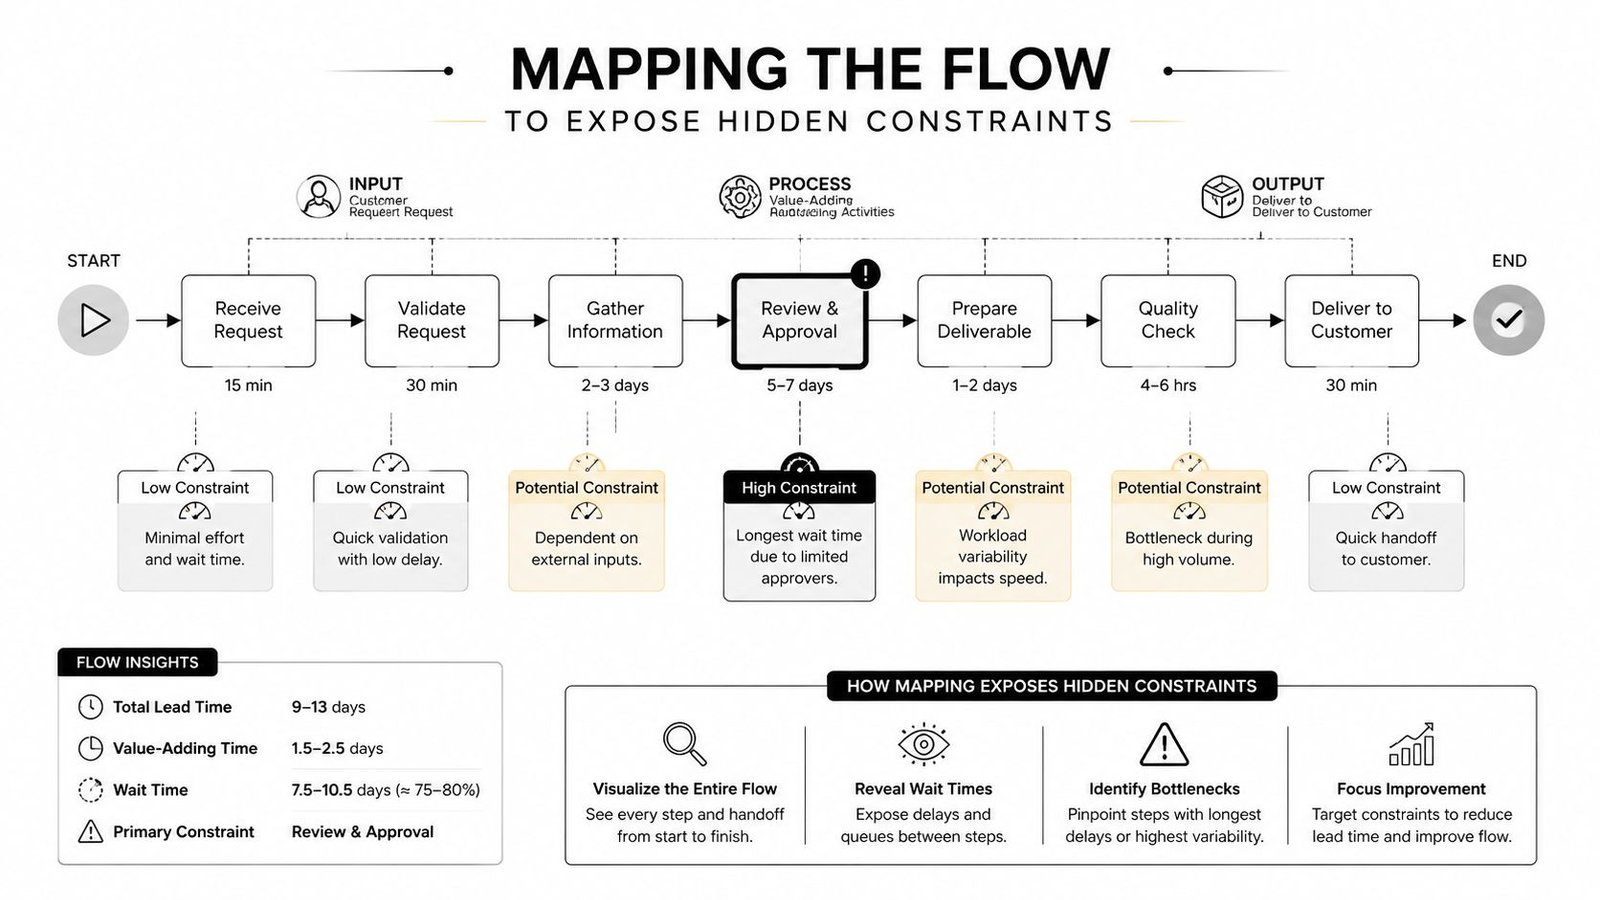
Use a process flow map to expose those relationships:
Increase constraint capacity
Act after the current constraint has been stabilized and the rest of the line is aligned. Options include dedicated tooling, automation, staffing changes, maintenance support, or process redesign. In a GMP environment, approval also depends on risk assessment, change control, updated work instructions, and validation planning.
The trade-off is timing. The constraint can shift before a GMP change package is approved, so use interim controls and current evidence rather than basing the decision on an outdated bottleneck.
Repeat the cycle
Improving one constraint can reveal another. Constraint management remains a repeating loop because the limiting resource can move after an intervention. The manufacturing constraint-management framework presents this continuing cycle in a structured form.
Make the five steps part of shift-level operations. Ask, “What is limiting output right now, and what evidence would prove that it has moved?” That question keeps attention on measured system performance instead of the loudest local symptom.
For help converting this diagnosis into a defined project, review throughput optimization services.
Measuring What Matters Without Drowning in Data
A bottleneck dashboard doesn't need every tag in the PLC. It needs a small set of measures that explain capacity, loss, output, and waiting. The core stack is cycle time, OEE, throughput, and WIP.
Cycle time shows how quickly each station completes work, including the losses that matter in actual operation. Compare observed cycle time with takt time, the demand-based pace required by the line. A station whose cycle time, including micro-stops and changeovers, exceeds takt is a bottleneck candidate, and the narrowest margin is often the most useful place to investigate first. Cycle time and takt-time bottleneck analysis
OEE adds context. Its availability, performance, and quality components help separate a slow process from a process that loses time through downtime, speed reduction, or rejects. Throughput tells you whether the suspected constraint is governing shipments. WIP reveals the queue that the other measures may hide.
| Metric | What It Measures | Diagnostic Signal |
|---|---|---|
| Cycle time | Time required to complete work at a station | Actual time exceeds takt or varies sharply by product or shift |
| OEE | Availability, performance, and quality losses | Loss category points to downtime, micro-stops, speed, or rejects |
| Throughput | Completed output from the line or constraint | Output remains capped despite improvements elsewhere |
| WIP | Material waiting or moving between stations | Persistent queue forms before one resource or disappears after a change |
Instrument the constraint first
Many lines already capture cycle time through a PLC but can't show WIP clearly. Add simple visibility where the diagnosis happens. A light stack can indicate blocked or starved states, an Andon pull can record operator-impacting interruptions, and a manual WIP tally at the feeder buffer can establish queue depth before a larger data project begins.
A monthly MES report won't help an operator decide whether the next interruption is starving the constraint. Put the relevant signals at the station, with clear status definitions and a short review routine. The dashboard should answer what is happening now, not only what happened last month.
Use the station's highest utilization as a clue, not a verdict. One industry source describes highest utilization as a common constraint indicator and notes that actual cycle time exceeding planned cycle time by more than 5–10% typically signals process drift worth investigating. Machine performance monitoring guidance on utilization and cycle-time drift
Start narrow. Instrument the suspected constraint, then its feeder and discharge stations. Expand outward only after the governing constraint has been validated. That approach keeps the data collection effort proportional to the decision and supports manufacturing data analytics without turning the shop floor into a reporting exercise.
Mapping the Flow to Expose Hidden Constraints
A cycle-time chart can say two stations are fast while the line still loses hours between them. That gap usually comes from waiting, transport, inspection hand-offs, feedback loops, or a buffer that isn't included in the station calculation. Mapping makes those losses visible.
Value Stream Mapping exposes time-based gaps. Mark process time, waiting time, WIP locations, inspection points, and release decisions. A full buffer before a station suggests capacity pressure, but a nearly empty buffer before the same station may show starvation. The map should capture what operators do, not what the standard work document says they do.
A spaghetti diagram adds the physical dimension. Trace the movement of parts, operators, tools, and paperwork. Long travel between an upstream process and the suspected constraint can force larger buffers, increase replenishment exposure, and create interruptions that never appear in the PLC cycle-time record.
Use Little's Law as a reality check
Little's Law connects the map to observed flow:
WIP = Throughput × Cycle Time
Apply it at the line level and, where the boundaries are clear, between individual stations. If measured WIP is greater than the relationship predicts, don't immediately label the equation wrong. Look for a hidden queue, an unrecorded wait, a rework loop, or a cycle-time definition that excludes staging and inspection.
Layer the views into one shop-floor artifact:
- VSM evidence: Mark where time gaps and WIP piles occur.
- Spaghetti evidence: Overlay travel paths and replenishment routes around the suspected constraint.
- Little's Law check: Compare reported cycle time with throughput and observed WIP.
- State confirmation: Record whether the station is processing, starved, blocked, or waiting for approval.
The combination is stronger than any single map. A VSM may identify a long wait, the spaghetti diagram may explain why material arrives late, and Little's Law may show that the published cycle time omits the queue entirely. Teams improving their mapping discipline can use these process mapping best practices to keep the artifact consistent across shifts and product families.
Turning Bottleneck Findings into Automation Wins
A validated bottleneck deserves a controlled improvement project, not a vague wish list of faster equipment. Write the constraint statement first. Name the station, describe the symptom, and state the evidence that triggered the investigation, such as WIP buildup, overtime, or recurring quality rework.
Then establish a baseline over a defined production window. Capture actual cycle time, first-pass yield, changeover duration, downtime reasons, and the product mix being run. Without that baseline, a new automation cell can appear successful just because the comparison shift had fewer difficult jobs.
Compare fixes by more than speed
Candidate interventions should include automation, dedicated fixturing, poka-yoke, and recipe standardization. For each option, document the predicted cycle-time reduction, capital requirement, operator impact, maintenance needs, and validation path.
| Constraint Symptom | Candidate Fix | Predicted Cycle-Time Gain | GMP Validation Scope |
|---|---|---|---|
| Manual verification delays the station | Servo-driven verification station | Confirm through a controlled trial | Define IQ/OQ/PQ scope, controls review, and work-instruction updates |
| Parts require repeated alignment | Dedicated fixture with poka-yoke | Measure repeatability and handling time | Assess fixture qualification, drawings, materials, and cleaning requirements |
| Changeovers consume constraint time | Recipe standardization and guided setup | Compare changeover duration by product | Review recipe control, access permissions, and change-control records |
| Rework interrupts the constraint | In-process error detection | Measure first-pass yield and interruption reduction | Define inspection validation, data integrity, and NCR disposition controls |
GMP documentation shapes the decision. An improvement that is technically effective may require IQ, OQ, and PQ planning, updates to the validation master plan, risk assessment, traceability changes, and approved procedures. Those requirements aren't reasons to avoid automation. They are design inputs that should be considered before the concept is finalized.
Test one shift before scaling
Run a controlled trial on one shift with paired before-and-after observations. Keep the product family, staffing conditions, and measurement definitions as consistent as practical. Record whether the intervention improves the governing constraint or only makes a neighboring station look better.
A useful example is manual torque verification at an assembly constraint. Replacing it with a servo-driven station cut cycle time by 22 percent, eliminated a recurring NCR, and paid back in eleven months. Those figures come from the specified shop-floor example and should be treated as an example of the required evidence pattern, not a promise for every application.
The wider lesson is straightforward. Automation should remove the loss that limits throughput, not modernize a station. System Engineering & Automation provides semi-automatic systems, fully automated and manual equipment, custom tooling, fixtures, and integrated controls, with GMP-aware engineering support that can fit this type of constraint-led project.
Keeping Up with the Bottleneck That Keeps Moving
A bottleneck identified last month is evidence from a past operating condition, not proof of today's constraint. On a semi-automated line, product mix, shift staffing, raw-material lot variation, scheduled changeovers, equipment condition, and operator method can change which station governs flow within a shift.
Static identification breaks down after a successful improvement. The team raises capacity at one resource, output increases, and a downstream pack-out station becomes the new choke point. The original station may run cleanly on the current SKU while another station absorbs changeover losses.
Set a short detection loop
Use a review cadence matched to operating risk, rather than waiting for a quarterly performance review.
- Weekly review: Compare station-level WIP and queue depth with Little's Law predictions, then investigate persistent gaps.
- Monthly walk-through: Reuse the same spaghetti diagram to find layout drift, replenishment changes, and added travel burdens.
- Immediate re-validation: Repeat the diagnosis after introducing a new SKU, equipment change, or shift pattern.
- Shift-level observation: Have supervisors record starvation, blockage, and recurring manual intervention during handover.
The purpose is not to chase every fluctuation. It is to keep production decisions connected to current line conditions. A station with the highest utilization may be reacting to a temporary product mix. A lower-utilization station may limit output through intermittent downtime, quality holds, or repeated manual recovery.
A systematic review describes bottleneck detection as a fragmented field, grouping methods by their information sources and examining approaches suited to different data collection burdens. The systematic review and bottleneck detection taxonomy The practical implication is clear: use a repeatable detection loop that fits the information available on your line, instead of treating one metric as universally reliable.
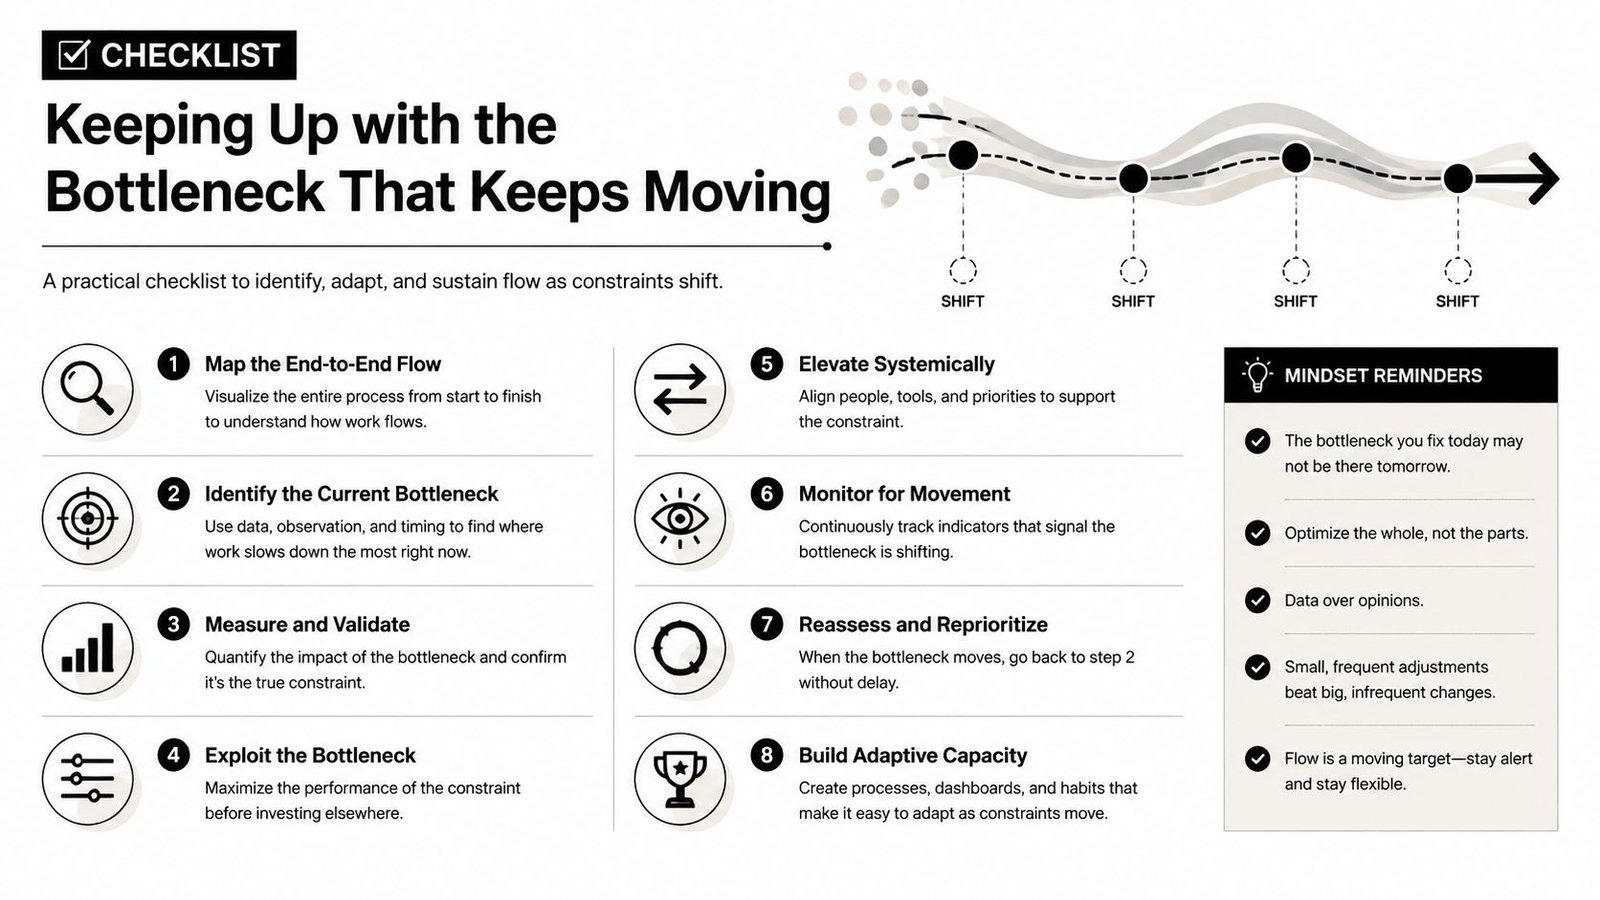
Keep three questions visible at the production board: What limits throughput now? What changed since the last diagnosis? What evidence would confirm that an intervention moved the constraint? In GMP environments, the answers also determine whether a proposed fix can proceed through risk assessment, traceability review, and approved validation work. A sound automation roadmap follows the line operating today, not the line measured last quarter.
System Engineering & Automation offers semi-automatic systems, custom tooling, fixtures, integrated controls, and GMP-aware engineering support for manufacturers addressing validated production constraints. Visit System Engineering & Automation to discuss bottleneck findings, define a practical pilot, and plan an improvement aligned with throughput, quality, and validation requirements.