
A CNC cell can run smoothly while its measurement system sends the wrong message without warning. The parts look consistent on the machine monitor, operators follow the work instruction, and the scrap report shows a persistent problem. Then a quality engineer compares the gauge records with a traceable reference and discovers that the variation is not coming from the material or cutting process. The fixture, sensor, software, or measurement technique has drifted.
That situation is common in manufacturing environments that are moving from manual inspection toward semi-automated production. A measurement system may include a gauge, fixture, vision camera, robot loading sequence, operator decision, and software algorithm. Measurement system analysis gives the team a disciplined way to separate genuine part variation from measurement noise before that noise drives scrap, false acceptance, audit findings, or customer complaints.
Table of Contents
- Why Measurement Quality Decides Production Quality
- What Measurement System Analysis Actually Measures
- The Five Error Lenses Behind Every MSA
- Running an MSA Study From Planning to Interpretation
- Reading GR&R Numbers the Way Engineers Actually Use Them
- MSA in Semi-Automated and GMP-Aware Production
- From MSA Report to Lasting Production Control
Why Measurement Quality Decides Production Quality
The production team had been discussing material variability for weeks. A CNC cell was producing a 1.8% scrap rate, and the working assumption was that incoming stock was changing from lot to lot. The process engineers checked tool life and offsets. The operators checked loading. Nothing explained why apparently stable parts were failing inspection.
A senior engineer pulled the measurement data and compared repeated readings on retained parts. The gauge was no longer behaving consistently. Its readings had shifted enough to make acceptable parts look suspect, while some borderline parts passed because the system was no longer separating real dimensional change from instrument drift. The scrap report described the symptom, not the cause.
Practical rule: Before adjusting a stable process, prove that the measurement system can distinguish a process change from a measurement change.
A part can't be better than the system used to measure it. If a vision camera reports a dimension incorrectly, the control plan may trigger unnecessary adjustments. If a fixture presents the part differently each time, the operator may chase a position error. If the release screen displays an alarm without making the decision logic clear, two trained inspectors can reach different conclusions from the same evidence.
Measurement system analysis matters because production decisions depend on measured data. It helps quality and operations teams examine whether observed variation comes from the part, the instrument, the operator, the method, or the environment. The discipline became more formal over time. The first AIAG MSA manual for the American automotive industry was published in 1990, updated in 1995 for QS-9000 requirements, and reached a third edition in 2002. A related international effort to define measurement uncertainty began in 1977 and culminated in the 1995 ISO Guide to the Expression of Uncertainty in Measurement. These milestones show how MSA developed from a specialized automotive quality tool into a recognized framework for evaluating repeatability, reproducibility, and uncertainty across industries. (MSA history and development)
On a semi-automated line, MSA isn't a document completed after commissioning. It's a foundational production control. The measurement boundary may run from robot loading through fixture location, sensor capture, algorithmic calculation, and the operator's final interpretation.
What Measurement System Analysis Actually Measures
Start with a calibrated bench scale. Place the same component on it repeatedly and record the displayed weight. If the readings move, the movement may come from the scale, the placement technique, vibration, temperature, or the component itself. The scale doesn't know which source caused the change. MSA separates those sources so the team can decide whether the number is suitable for process control.
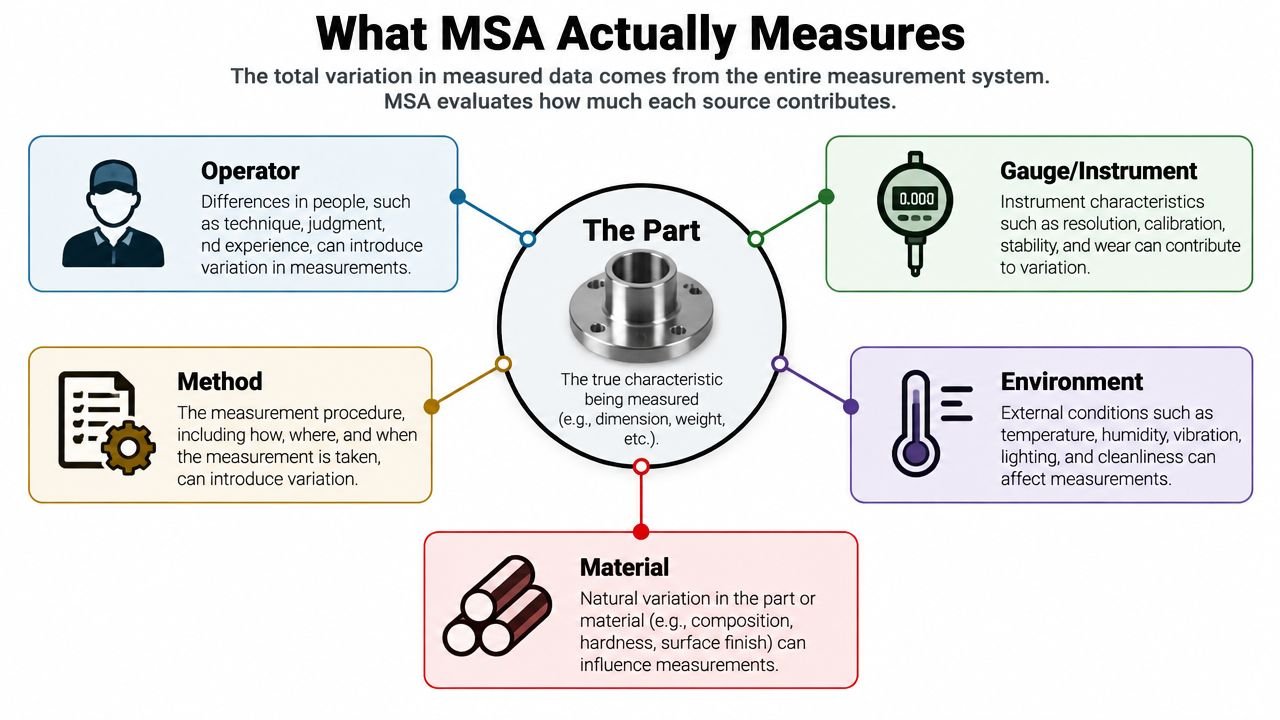
A measurement system is the complete chain that produces a reported result:
- Gauge or instrument: The device captures the physical characteristic.
- Fixturing: The fixture positions, supports, or constrains the part.
- Operator: A person loads the part, starts the test, interprets the display, or responds to an alarm.
- Method: The work instruction defines how the measurement is taken.
- Environment: Temperature, lighting, vibration, humidity, and cleanliness can influence the result.
- Software: Recipes, algorithms, data filters, interfaces, and decision rules can change what the system reports.
The part itself contributes genuine part-to-part variation. The measurement system adds its own variation. Together, those components create the total variation seen in the dataset. The practical question isn't whether every reading is identical. It's whether the system's contribution is small and stable enough that the team can identify meaningful differences between parts.
A digital caliper on a molded cover illustrates the idea. The same operator may measure the same feature repeatedly and obtain slightly different values. That is repeatability. A second operator may use different pressure or hold the cover at another angle. That is reproducibility. The gauge may consistently read above a traceable reference, which indicates bias. The offset may change at different feature sizes, which indicates linearity. The reading may change across shifts or weeks, which indicates stability.
For a non-statistician, the nesting is straightforward. Observed variation contains part variation and measurement variation. Measurement variation contains different error mechanisms that need different corrective actions. A replacement gauge won't fix a fixture that locates the part inconsistently, and operator retraining won't correct a software recipe that changed after an update.
The core MSA question is simple: Can we trust the numbers coming off this measurement system enough to control the process with them? The Six Sigma tools and techniques overview provides useful context for where MSA fits within broader process improvement work.
The Five Error Lenses Behind Every MSA
A Gage R&R study is important, but it isn't the entire measurement system analysis. Repeatability and reproducibility describe precision. Bias, linearity, and stability expose different problems that can remain hidden when a team looks only at one headline result.
Repeatability
Repeatability is the variation produced when the same instrument measures the same part repeatedly under the same conditions. Consider a digital caliper measuring the wall thickness of an injection-molded cover. If the operator follows the method but the readings move noticeably, the cause may be worn jaws, inconsistent contact force, poor resolution, or a feature that flexes under measurement pressure.
Repeatability is a property of the equipment and immediate method. It doesn't tell you whether different people can use the system consistently.
Reproducibility
Reproducibility is the variation between different operators measuring the same part with the same gauge. Two inspectors checking a machined flange may position the gauge differently, use different clamping pressure, or interpret a display threshold differently. In an automated cell, reproducibility can also include different software settings, recipes, user permissions, or loading sequences.
The distinction matters. If repeatability dominates, investigate the instrument, fixture, or method. If reproducibility dominates, examine training, ergonomic access, instructions, and the human-machine interface. (Definitions of repeatability and reproducibility)
Bias
Bias is the average offset from a traceable reference standard. A gauge can produce highly consistent readings and still be consistently wrong. For example, a temperature sensor may report a value above the reference every time. That problem calls for calibration review, correction, or replacement, not more operator practice.
Linearity
Linearity tests whether bias changes across the measurement range. A sensor may read correctly near the middle of its range but increasingly high or low near the limits. A bore gauge that performs well on a small feature but shifts on a larger one can pass a narrow study while failing the actual production range.
Stability
Stability checks whether the same gauge and parts remain consistent over time. Drift may follow temperature cycles, contamination, vibration, battery condition, component wear, or software changes. Stability evidence should inform calibration intervals and maintenance planning, rather than leaving those intervals disconnected from actual performance.
These lenses overlap, but they answer different questions. A healthy study reports on all five when the risk warrants it, rather than treating a passing GR&R value as proof that the entire system is accurate and controlled.
| Error Lens | What It Captures | Typical Shop-Floor Trigger |
|---|---|---|
| Repeatability | Variation from repeated readings by one operator with one system | Worn gauge, flexible feature, inconsistent contact |
| Reproducibility | Variation between operators, setups, or measurement executions | Different loading technique or unclear work instruction |
| Bias | Offset from a traceable reference | Calibration error or incorrect master |
| Linearity | Change in bias across the operating range | Sensor response that shifts near specification limits |
| Stability | Change in measurement behaviour over time | Thermal drift, contamination, wear, or software change |
Running an MSA Study From Planning to Interpretation
A defensible study follows one connected flow. The quality team shouldn't select parts first, collect convenient readings, and decide afterward what the results mean. The denominator and decision need to be defined before the first measurement.
Plan the question
Start with the critical-to-quality characteristic. Define the specification tolerance, the expected process variation, the measurement range, and the production decision the result will support. A gauge used for incoming inspection may need to demonstrate a different level of capability than one used for a rough in-process check.
Decide whether the study needs variable data, attribute decisions, destructive testing, or automated-system evaluation. For a standard Gage R&R, a common setup uses one gage, 10 or more parts, one to three appraisers, and one or more trials per appraiser. (Common Gage R&R study design)
Sample the real process
Select parts that represent the actual production range, including meaningful low, middle, and high conditions where appropriate. Avoid choosing ten nearly identical parts just because they're easy to find. A narrow sample can hide the measurement system's inability to distinguish real production differences.
Select operators who normally use the system. Randomize the measurement order and prevent operators from seeing previous results. For fixtures, document whether the part is removed and reloaded between trials. A clamp that locates differently after each reload must be treated as part of the measurement system, not as an inconvenient detail.
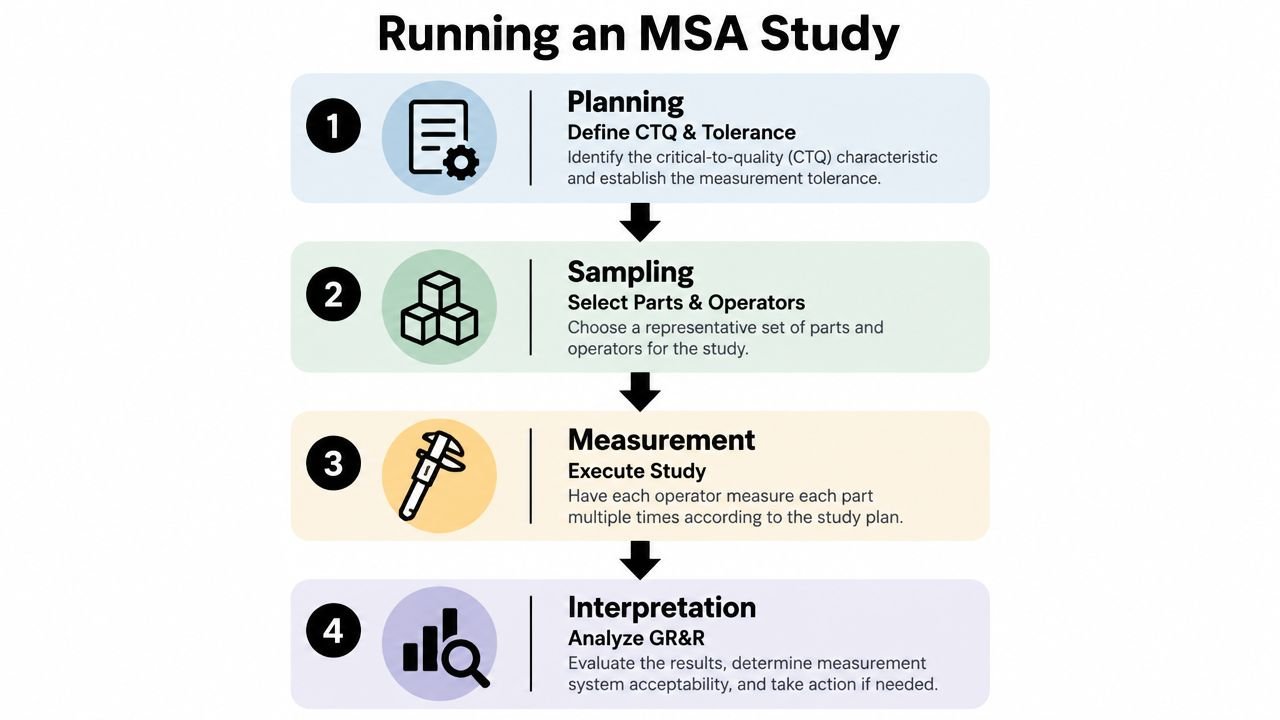
Measure and partition
Run the study under normal conditions, while controlling factors that aren't part of the question. Record operator, part, trial, time, fixture position, software version, and relevant environmental conditions. The analysis then partitions observed variation into part-to-part variation, equipment repeatability, and operator reproducibility.
Teams commonly use ANOVA or the range method. The method matters less than preserving the connection between the dataset and the decision. A report that produces a percentage without showing which component dominates gives the line lead little direction.
The fixture may be the right corrective target. Custom test fixtures can help when the measurement problem originates in repeatable positioning rather than the sensor itself.
Interpret and act
Compare the measurement contribution with both the study variation and the production tolerance. Inspect variance components, operator interactions, part-by-operator patterns, and unusual readings. Then assign the action to the actual cause:
- Gauge issue: Repair, replace, recalibrate, or improve resolution.
- Fixture issue: Improve location, support, clamping, or poka-yoke features.
- Method issue: Rewrite the work instruction and clarify contact or loading conditions.
- Operator issue: Retrain and verify technique at the point of use.
- Software issue: Review recipe, algorithm, version, permissions, and change history.
The final acceptance line should state the intended use, the evidence reviewed, the limitations, the owner, and the required follow-up. That narrative makes the study understandable at an audit and useful on the shop floor.
Reading GR&R Numbers the Way Engineers Actually Use Them
A GR&R percentage has no practical meaning until the denominator is clear. The same measurement system can look reasonable against tolerance and poor against the variation that the process is producing. Teams should therefore review %GRR relative to study variation and precision-to-tolerance, rather than treating one percentage as a universal pass or fail. (Why both variation and tolerance matter)
The familiar decision bands are useful starting points. Less than 10% R&R is generally considered good, 10% to 30% may be acceptable depending on the application, and more than 30% usually indicates that the measurement system needs improvement. Acceptance in the conditional range depends on application importance, measurement cost, and the cost or risk of rework or repair. Customer approval may also be required before using the system for process control. (Application-dependent acceptance criteria)
| Metric | Acceptable Range | Marginal Range | Unacceptable Range |
|---|---|---|---|
| %GRR against study variation | Under 10% | 10% to 30% | Over 30% |
| %GRR against production tolerance | Under 10% | 10% to 30% | Over 30% |
| Precision-to-tolerance | Under 10% | 10% to 30% | Over 30% |
The denominator changes the question. %GRR against study variation asks whether the system can resolve the part differences represented in the sample. P/T asks whether measurement error is small compared with the engineering tolerance. A stable process with a tight spread can make the gauge look worse against process variation even when it appears acceptable against tolerance.
Number of distinct categories adds another useful lens. If the system can reliably separate only three or fewer categories, it may not distinguish good product from bad product with enough resolution for the intended decision. This is especially important when the process is tightly controlled and the parts look very similar.
Read the chart before the headline. A variance component chart often shows whether the problem is equipment, operator, interaction, or an unrepresentative part sample.
A borderline result isn't automatically a rejection, but it isn't a free pass either. Document the use case, risk, customer requirements, and improvement plan. A gauge approved for a broad screening decision may be unsuitable for releasing a critical characteristic close to its specification boundary.
MSA in Semi-Automated and GMP-Aware Production
On a semi-automated cell, the measurement system rarely begins at the sensor. A robot picks the part, a fixture locates it, a vision camera captures an image, an algorithm extracts a feature, and an operator reviews an alarm before release. Each link can add variation, and the final result is only as reliable as the weakest link in that chain.
A fixture can introduce position-to-position bias that doesn't appear during a bench-gauge study. If one clamp seats a molded component against a hard stop and another leaves it slightly tilted, the camera may report a dimensional difference that belongs to loading, not the part. The sensor can be perfectly calibrated and still deliver misleading results because the part arrives in a different pose.
Lighting creates another failure mode. A vision system may detect an edge differently when illumination, reflection, contamination, or camera exposure changes between shifts. In that situation, the algorithm isn't necessarily unstable in isolation. The integrated system is responding to an uncontrolled measurement condition.
Software version is often overlooked. A recipe revision, threshold change, image filter, or algorithm update can become a reproducibility factor even when every operator performs the same physical action. The release decision may change because the computer processed the same image differently.
The inspection boundary should follow the production decision, not the equipment label.
For GMP-aware production, the evidence package needs to address computerized systems and controlled changes, not only handheld instruments. Vision recipes, lighting calibration, robot programs, user access, data handling, and alarm logic belong in the same validation conversation as the original gauge study. The exact documentation will depend on the product, process, and quality system, but the principle is consistent: preserve traceability from input condition to final disposition.
Extend the study boundary upstream. Include loading, fixturing, sensing, data processing, and operator release. Record the relevant recipe and software version, define what changes require requalification, and test the cell under the conditions it will encounter. Vision inspection systems are most useful when their measurement capability is demonstrated as part of the production workflow rather than assumed from the camera specification.
This approach also applies to inline measurement, robotics, AI-assisted inspection, and autonomous inspection systems. Classic GR&R thresholds remain useful, but they don't replace validation of data pipelines, algorithms, integrated sensors, and change control.
From MSA Report to Lasting Production Control
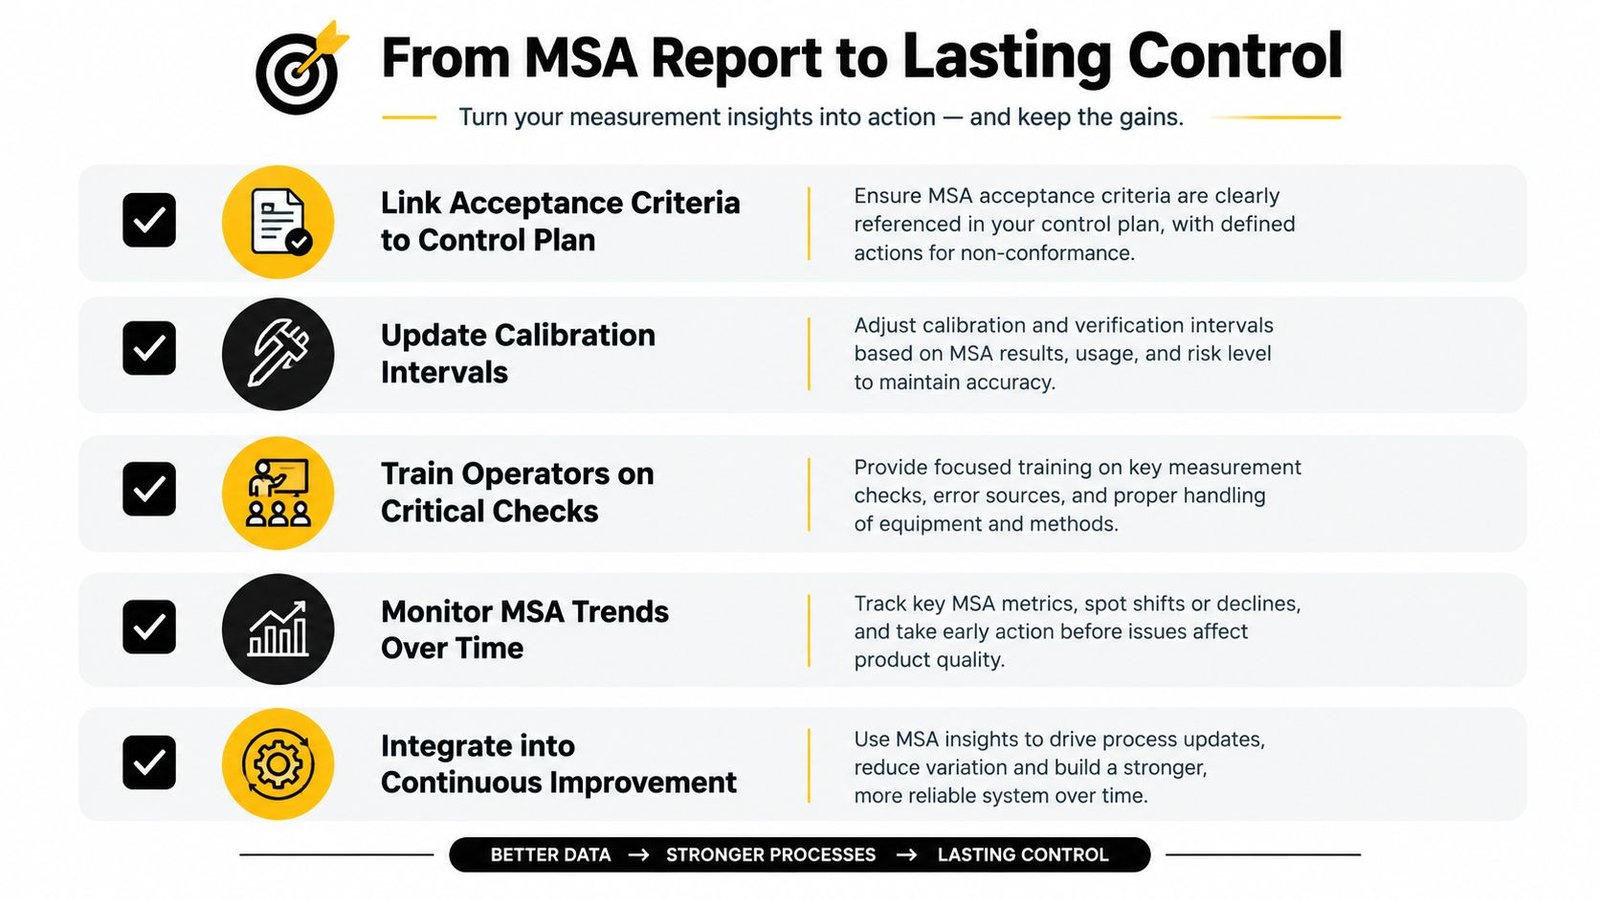
An MSA report stored on a shared drive won't change a process by itself. The useful handoff happens when the quality engineer gives the line lead a clear answer about what was approved, for which characteristic, under which conditions, and what must happen when the system changes.
The control plan should carry the acceptance criteria and the measurement method forward. Calibration intervals should reflect observed stability and drift, not just a generic calendar. If a fixture, sensor, robot program, vision recipe, or algorithm changes, define the requalification trigger before the change request arrives.
Make ownership visible
A practical one-page MSA summary should identify:
- Measurement purpose: The characteristic and production decision supported.
- System boundary: Gauge, fixture, operator, software, environment, and release step included.
- Study design: Parts, appraisers, trials, order controls, and operating conditions.
- Results: Repeatability, reproducibility, bias, linearity, stability, and relevant denominators.
- Decision: Approved, conditionally approved, or requiring improvement.
- Owner and due date: The person responsible for each corrective action.
- Change triggers: The modifications that require a new study or focused check.
For GMP batch records, reference the approved measurement method, instrument or system identification, calibration status, applicable recipe or software revision, and the recorded result or disposition. Keep those references controlled and traceable to the current procedure.
Keep the system under observation
A full study is a qualification event, not the only monitoring activity. Control charts, calibration records, maintenance logs, alarm reviews, and operator feedback can reveal drift before a recurring MSA becomes necessary. Semi-automated cells often benefit from lightweight quarterly checks between more studies, especially after cleaning, fixture service, recipe updates, or repeated false alarms.
Train operators on the critical checks that protect the measurement chain. They should know how to verify seating, lighting, reference parts, alarm interpretation, and escalation. The aim isn't to turn every operator into a statistician. It's to make abnormal measurement behaviour visible while the cell is still running.
Use the report as a living control document. Feed recurring issues into fixture redesign, sensor selection, software change control, preventive maintenance, and continuous improvement. The best MSA work doesn't end with a green result. It gives production a reliable basis for deciding what to adjust, what to hold, and what to release.
System Engineering & Automation designs semi-automatic systems, custom tooling, fixtures, integrated controls, and GMP-aware manufacturing solutions that help teams strengthen measurement and production control. Visit System Engineering & Automation to discuss your cell, fixture, or inspection challenge and identify a practical automation approach that fits your quality goals, budget, and operating constraints.