A line is missing its hourly target again. The supervisor walks the cell, sees operators waiting on material, a fixture that takes too long to load, and rework being held for inspection. By the end of the shift, the explanation in the report is “operator performance.”
That diagnosis is often wrong. A performance improvement plan in manufacturing should address the operator when the operator owns the gap, but it should also test the process, tooling, material flow, training, and measurement system. If the constraint sits in the operation, putting more pressure on people won't restore capacity. It will usually create more variation, more defects, and less trust.
Table of Contents
- Why Most Manufacturing Performance Plans Fail
- Building Your Performance Improvement Plan Framework
- Root-Cause Analysis Tools for Production Bottlenecks
- Choosing the Right Improvement Lever
- Setting Timelines, Roles, and Accountability
- Measuring Results and Calculating Real ROI
- Practical Tips and Common Pitfalls to Avoid
Why Most Manufacturing Performance Plans Fail
Every production manager has seen the same sequence. Output falls below plan, quality complaints increase, and supervisors tighten oversight. They remind operators to work faster, add another sign-off, and warn that the next missed target will be documented. The station still misses output because the actual problem may be a poorly designed fixture, late material replenishment, unstable settings, or a handoff that keeps interrupting the work.

A useful plan starts by separating performance ownership from performance cause. An operator may be accountable for following the standard work, but the plant still has to verify that the standard is clear, the tools are available, the equipment works as intended, and the target reflects the actual job. A plan that skips those checks is a disciplinary document, not an improvement system.
The warning sign in the data
Formal performance procedures became more common in the early 2020s. A 2023 U.S. estimate cited in secondary reporting found that 43.6 workers per 1,000 were involved in formal performance procedures, compared with 33.4 per 1,000 in 2020, a rise of about 30.5% in three years according to the cited secondary reporting. That increase doesn't prove that formal plans improve operations. It does show why managers need to distinguish a genuine capability intervention from a process for documenting an exit.
Start with the station, not the personality. Observe the work across shifts, record waiting and changeover causes, check defect patterns, and compare actual cycle conditions with the documented standard. A bottleneck identification assessment can help expose where capacity is being lost before the plant assigns the gap to an individual.
Practical rule: If several capable operators struggle at the same station, treat the station as the suspect until the evidence points elsewhere.
The operational test is simple. If a person improves only when a supervisor stands beside them, the plan may be changing behavior without fixing the system. If the station improves after tooling, material flow, or work instructions change, the original “people problem” was probably a process problem wearing a human face.
Building Your Performance Improvement Plan Framework
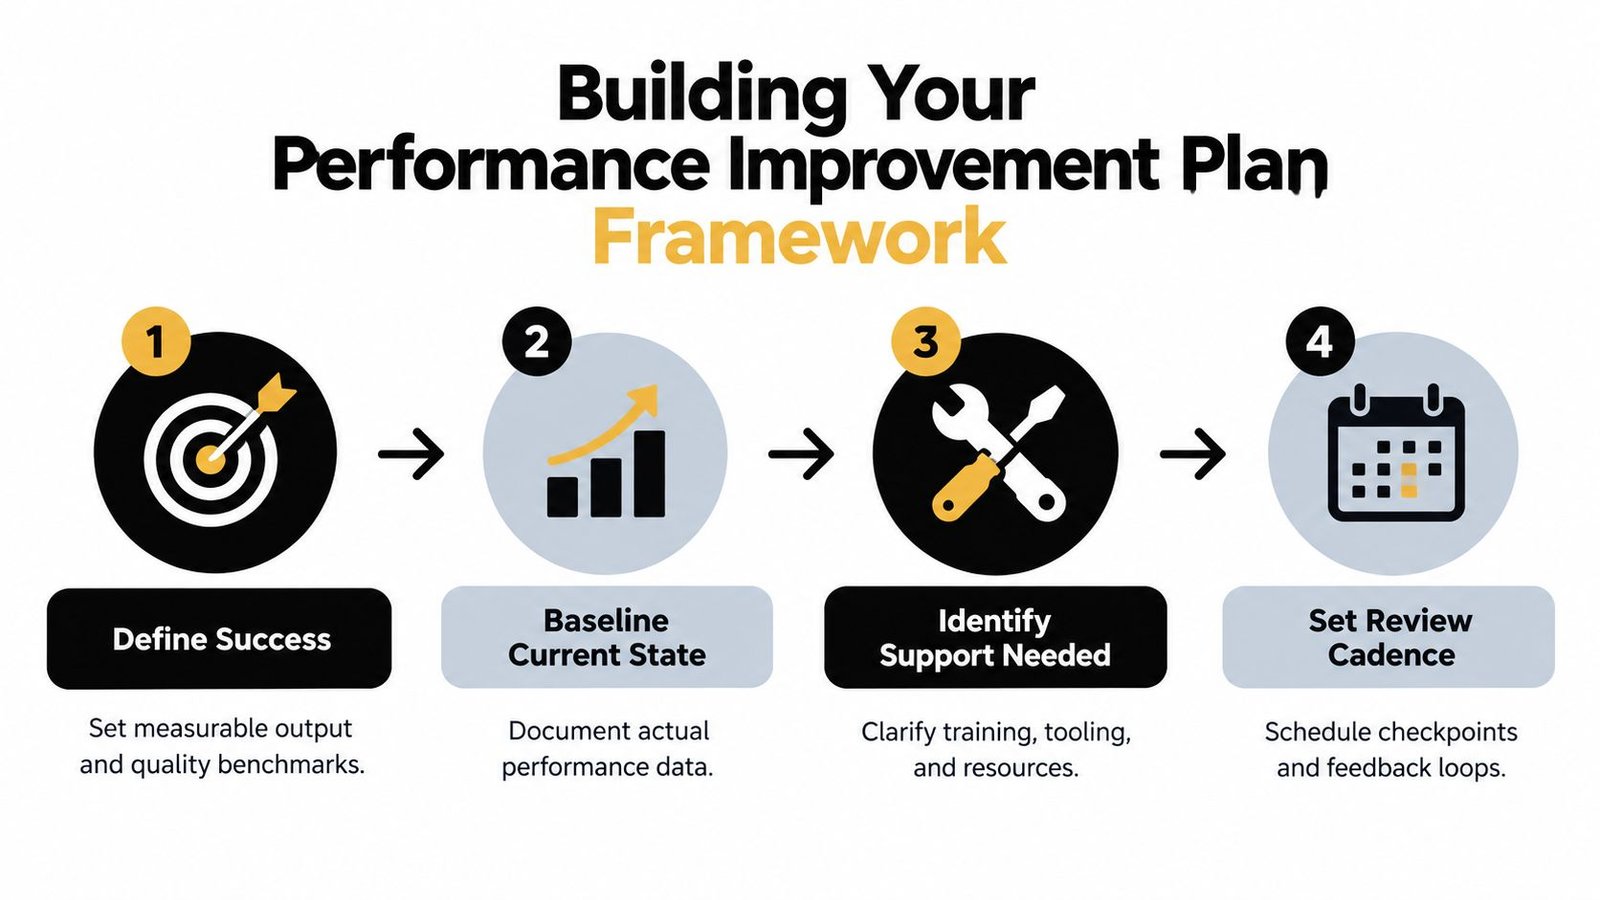
A sound plan begins with a measurable definition of success. Don't open with consequences or broad language such as “show more urgency.” Define the required output, quality result, and critical job elements in terms an operator, supervisor, and quality lead can evaluate the same way.
The U.S. Office of Personnel Management supervisor guide describes a stepwise control loop. The written plan should identify specific deficiencies, critical elements, success criteria, support and training, consequences if performance doesn't improve, and a 30-business-day typical duration.
Start with the baseline
Record the current state before selecting a remedy. Use the same definitions throughout the plan, otherwise the team will argue about measurement instead of improving the operation.
- Output: Define acceptable completed units, not pieces moved into a queue.
- Quality: Separate first-pass yield from units later recovered through rework.
- Time: Capture cycle time, waiting time, changeover time, and downtime separately.
- Compliance: Include required checks, traceability, and safe work practices where they are critical job elements.
The baseline should include the conditions around the work. Note the product mix, shift, equipment status, staffing, material availability, and applicable work instruction. A target that ignores those variables can punish an operator for variation the operator can't control.
Convert the gap into SMART targets
Each target should state what must change, how it will be measured, and when the review will occur. “Improve productivity” is unusable. “Complete the defined standard work sequence while meeting the approved quality check” gives the supervisor something observable to coach.
Keep the number of targets limited. A plan overloaded with every possible metric makes priorities unclear. Tie each target to a critical job element, then identify the evidence that will confirm progress, such as production records, inspection results, downtime codes, or direct observation.
Document support and reviews
Support belongs in the plan, not in a manager's memory. Specify who will provide training, which tooling or information will be available, and how the supervisor will remove barriers. Set short review checkpoints so the team can correct a bad assumption before the final assessment.
The plan should read like a controlled operating document. It needs a baseline, target state, owner, evidence source, support action, review date, and defined outcome. Local employment requirements and company policy still govern the employee process, but operational clarity makes the plan fairer and more useful.
Root-Cause Analysis Tools for Production Bottlenecks
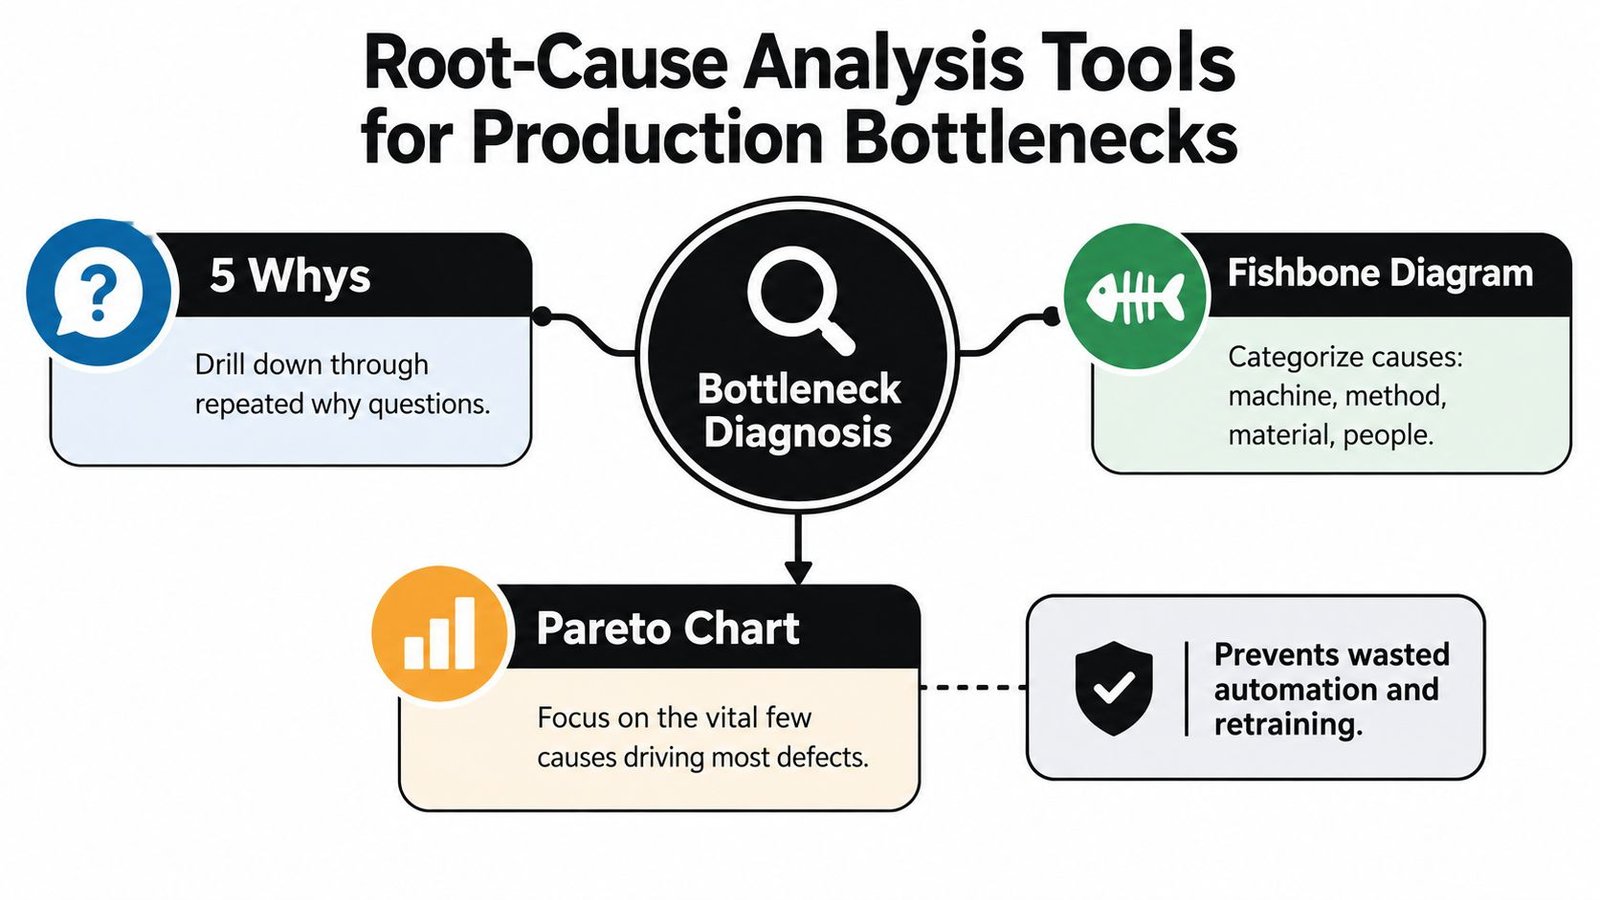
A production gap rarely announces its true cause. “The operator is slow” might mean the operator is searching for components, compensating for a worn locator, waiting for quality approval, or repeating a difficult motion that the process designer never measured. Root-cause analysis prevents the plant from buying automation or assigning retraining before it understands the constraint.
Use 5 Whys on a specific failure
Take a precise problem, such as “the cell misses the standard output during the afternoon shift.” Ask why the gap occurs, then verify each answer with observation or records.
- The operator misses output because the station waits for components.
- The station waits because replenishment arrives after the bin is empty.
- Replenishment arrives late because the route is triggered by a verbal request.
- The request is late because the standard work doesn't define a reorder signal.
- The process lacks a visual replenishment control and an assigned response.
The corrective action isn't “work faster.” It may be a defined point-of-use quantity, a replenishment trigger, and ownership for the material route. The 5 Whys works when each answer is testable. It fails when the team uses it to reach a preferred conclusion.
Map competing causes with a fishbone
A fishbone diagram helps when multiple causes may interact. Build branches for machine, method, material, measurement, environment, and people, then populate them with observed possibilities. For a recurring dimensional defect, the list might include fixture wear, unclear torque instructions, material variation, gauge calibration, temperature, and operator technique.
Pareto analysis can then focus the response on the causes that account for the largest share of verified defects or delays. The plant should not automate every nuisance or retrain every operator when one fixture, one material issue, or one handoff creates most of the loss. Teams that want a broader set of structured methods can use these Six Sigma tools and techniques to standardize the investigation.
The distinction matters because the improvement lever depends on the cause. A fixture defect needs tooling action. A knowledge gap needs training. A flow problem needs layout or replenishment changes. A repetitive, stable constraint may justify automation, but only after the team confirms that automation will address the verified failure mode.
The example below illustrates how a targeted intervention can change the economics of a station.
A study of automation in a refrigerator outer-door forming process reported a takt-time reduction from 12 seconds to 8.5 seconds, an 80% operator reduction from 10 workers to 2, and a 41% increase in hourly production in the documented process study. Those results are specific to that process, not a promise for every factory. The useful lesson is diagnostic: the team changed the operation that constrained throughput rather than just demanding more effort from the existing workforce.
Choosing the Right Improvement Lever
The right intervention depends on the failure mode. Automation, tooling, retraining, and process redesign solve different classes of problems. Treating them as interchangeable creates unnecessary capital cost or leaves the original gap untouched.
| Improvement lever | Best fit | Main trade-off |
|---|---|---|
| Automation | Repetitive, high-volume work with stable specifications | Requires engineering, integration, maintenance, and operator adoption |
| Tooling and fixtures | Precision, repeatability, ergonomics, and difficult manual positioning | Can solve the station while leaving upstream flow problems intact |
| Process redesign | Congestion, excess motion, poor handoffs, and material delays | May require cross-functional agreement and disciplined standard work |
| Retraining | Verified skill gaps and variable, judgment-based work | Won't compensate for defective equipment or an impossible target |
Automation earns its place at a stable constraint
Automation is strongest when the task repeats, the input is controlled, and the required sequence can be specified. A peer-reviewed industry study found that a one-standard-deviation increase in industrial robot intensity was associated with more than 6.5% higher total factor productivity in the study's analysis. That is evidence of a measurable productivity mechanism, not a blanket guarantee for an individual line.
Automation also changes the labor profile. Operators may move from direct handling to loading, inspection, replenishment, troubleshooting, or control. Maintenance and controls capability become more important. A plant that ignores those requirements can trade a manual bottleneck for an automated downtime problem.
Tooling often beats a large project
A custom fixture, poka-yoke feature, lift assist, or guided tool can remove variation without removing the operator. This is often the practical choice for mixed models, moderate volume, frequent product changes, or operations where human judgment remains valuable. Tooling also provides a fast way to test a process hypothesis before committing to integrated equipment.
Process redesign attacks the work around the station
Repositioning materials, balancing work between stations, simplifying approvals, or changing the replenishment route can release capacity with less capital than a new machine. Retraining belongs in the plan only after the process is capable and the standard is clear. If several trained operators fail under the same conditions, adding another training module is usually a weak response.
System Engineering & Automation offers semi-automatic systems, fully automated and manual equipment, custom tooling, fixtures, and integrated controls, with support spanning design, sourcing, installation, and commissioning. That range is relevant when a manufacturer needs to match the intervention to volume, variability, budget, and available skills rather than force every problem into a fully automated solution.
Setting Timelines, Roles, and Accountability
A performance improvement plan needs an owner for every action. “The team will improve material flow” isn't an assignment. The production supervisor may own the daily standard, the quality lead may own inspection criteria, maintenance may own equipment condition, engineering may own the fixture change, and the operator must own the defined work sequence within the conditions the plant provides.
Build the schedule around actual dependencies. Procurement lead times, design approval, fabrication, installation windows, validation, and operator training all affect when a technical fix can produce evidence. Don't set a final target before checking whether the proposed support can exist during the review period.
Put the work on one visible schedule
Use a simple action register with these fields:
- Action and reason: State the verified cause being addressed.
- Owner: Assign one person, not a department.
- Due date: Use the date the action will be usable, not merely ordered.
- Evidence: Identify the record, observation, or test that confirms completion.
- Risk: Note what could delay the result and who will respond.
Hold short checkpoints at the frequency the work requires. Early reviews should confirm that the baseline is sound, support actions are happening, and the operator understands the standard. Later reviews should test sustained performance under normal production conditions, including expected mix and shift variation.
Execution rule: Accountability means owning both the result and the conditions needed to achieve it.
A supervisor shouldn't mark an operator as unsuccessful because a promised fixture wasn't available. Conversely, an operator shouldn't receive credit for a temporary result achieved by bypassing a quality control. Keep the technical plan and employee documentation aligned, but record facts separately from assumptions. That discipline gives managers room to correct the system without weakening accountability.
Measuring Results and Calculating Real ROI
Measurement should show whether the operation became more capable, not merely whether a report looked better. Track throughput, first-pass yield, cycle time, scrap, labor hours per unit, downtime, rework, and overtime when those measures relate to the bottleneck. Use leading indicators, such as completed training, fixture availability, response to replenishment signals, and adherence to the revised sequence, alongside lagging outcomes.
A plant can report higher output while steadily increasing scrap or overtime. That isn't a successful improvement plan. The result must be judged across the full operating system.
Separate the baseline from the intervention
Use a daily table with columns for date, product condition, planned output, good output, defects, rework, downtime cause, labor hours, and notable abnormalities. Add a short comment when the station ran under a temporary condition. Without that context, leadership may approve a solution based on a result that depended on unusual staffing or an unrepeatable production mix.
A practical example is a forming cell that misses output because operators wait for material and reset a difficult fixture. The team can measure good units, waiting time, reset time, defects, and labor hours before changing the cell. After the intervention, it can compare the same measures under comparable work conditions and calculate whether the improvement survives normal operation.
Calculate value beyond labor reduction
A useful ROI model includes:
- Added good output: Value the additional saleable production that the process can absorb.
- Avoided loss: Include scrap, rework, rejected material, and missed delivery consequences where they can be verified.
- Labor effect: Account for direct labor hours per unit, redeployment, and overtime rather than assuming every labor change is a cash saving.
- Ownership cost: Include engineering, installation, training, maintenance, spare parts, and downtime during implementation.
Research on U.S. manufacturing plants reported that more automated plants had higher labor productivity, lower production labor share, and higher capital share in the plant-level study. The finding reinforces a point managers sometimes miss: automation changes workforce composition as well as output efficiency. Use the automation ROI calculator to structure the financial assumptions, then validate them against the plant's actual production and quality records.
Practical Tips and Common Pitfalls to Avoid
A plan works when it stays connected to the work. Review it at the cell, use evidence operators recognize, and ask what prevented the required result before assigning another corrective action. Keep the conversation direct, but don't confuse pressure with control.
One industry guide reports that only about 20% to 30% of employees fully meet PIP objectives and remain long term, while 15% to 25% show partial improvement. It also estimates that 30% to 40% resign during or shortly after the plan, figures reported in the industry guide's discussion of PIP outcomes. These variable results are a warning against using a plan as exit management while calling it development.
Avoid the common traps
- Don't skip the baseline: A target without current-state evidence becomes an argument.
- Don't automate a bad process: Stabilize the method and verify the constraint first.
- Don't retrain around broken tooling: Fix equipment, fixtures, and material flow when they cause the gap.
- Don't hide support actions: Training and engineering changes belong in the same review record.
- Don't stop at the final review: Sustain the new standard through normal supervision and maintenance.
- Don't measure speed alone: Protect quality, safety, traceability, and total cost.
Talk with operators before changing the station. They often know where the work stops, which fixture binds, and which material arrives late, but they may not volunteer that information after repeated blame. A performance improvement plan should make those facts visible, assign the right owner, and leave the operation more capable than it was before.
System Engineering & Automation helps manufacturers turn verified bottlenecks into practical solutions through semi-automated systems, custom tooling, fixtures, integrated controls, installation, commissioning, and ongoing support. If your production gap may be rooted in process design rather than individual effort, visit System Engineering & Automation to discuss a solution matched to your equipment, quality requirements, and budget.