A lot of production teams are in the same position right now. Output targets keep climbing, operators are stretched, quality teams want tighter control, and every capital request gets challenged harder than the last one. You can feel where the bottleneck is, but “we know this station is slowing us down” isn't enough to justify new tooling, a semi-automated cell, or a GMP-aware assembly upgrade.
That's where production cost analysis stops being an accounting exercise and becomes an engineering tool. If you build it properly, it shows where margin is leaking, which process steps are absorbing labor and overhead, and whether automation will improve unit economics or just shift costs around. Done well, it gives operations, engineering, quality, and finance one shared baseline instead of four competing versions of the truth.
Table of Contents
- Beyond Spreadsheets Your Strategic Starting Point
- Defining Your True Production Costs
- Calculating Your Baseline Cost Per Unit
- Modeling the Financial Impact of Automation
- Building a Bulletproof Business Case for Investment
- Turn Your Analysis into a Competitive Advantage
Beyond Spreadsheets Your Strategic Starting Point
A spreadsheet usually enters the conversation too late. By the time someone opens one, the line has already shown recurring delays, operators have developed workarounds, and management is asking why labor keeps rising without a matching increase in output.
A stronger approach starts on the floor. Watch the process. Stand at the feeder, the assembly nest, the inspection station, the labeler, the pack-out bench. Time alone won't tell you enough, but sequence, waiting, handling, rechecks, and manual documentation will. Those are the places where production cost analysis exposes what a simple labor estimate misses.
In manufacturing, this discipline grew from bookkeeping into a management tool that separates direct materials, direct labor, and overhead, then turns those inputs into a per-unit cost baseline that managers can compare across departments and months, as explained in this managerial accounting reference on production cost reports. That matters because automation decisions fail when teams compare a future machine cost against an incomplete current-state labor estimate.
Start with the operational question
Don't ask, “Can automation replace labor?” Ask:
- Which station constrains throughput: The true bottleneck often sits upstream of the task everyone complains about.
- Where does quality consume hidden effort: Extra inspection, line clearance, batch record review, and rework handling all belong in the analysis.
- What cost driver changes if the process is redesigned: A semi-automated fixture may reduce touches, waiting, motion, and documentation burden at the same time.
- What production plan are you really trying to support: Expansion, product mix flexibility, GMP control, or operator safety each changes the right solution.
Practical rule: If your production cost analysis only compares current labor to future machine depreciation, it's too shallow to justify automation.
Capacity planning also belongs in the starting conversation. If demand shifts by product mix, batch size, or validation schedule, the automation concept has to support the operating model you run, not the one shown in last quarter's summary. That's why production teams often pair cost work with production capacity planning for constrained manufacturing environments.
The useful mindset is simple. Treat production cost analysis as the bridge between process reality and investment approval. It should reveal where a right-sized semi-automated system improves cost, control, and scalability, especially when a fully automated line would add complexity without enough operational benefit.
Defining Your True Production Costs
A line can look cheap until you price the work wrapped around the line.
I see this often in GMP production. The routing shows materials, operator time, and an overhead rate. The actual process also includes clearance checks, batch record entries, QA review, rework triage, cleaning, minor stoppages, and technician callouts. If those costs stay buried in department totals, the current state looks better than it is, and the automation case starts from the wrong baseline.
Why the baseline matters
A usable baseline is not just an accounting exercise. It is the reference point for deciding whether a semi-automated station, fixture, vision check, or handling system will pay back under real operating conditions. If the baseline leaves out compliance effort, indirect labor, or recurring instability, the future model will understate the benefit of automation and overstate the value of staying manual.
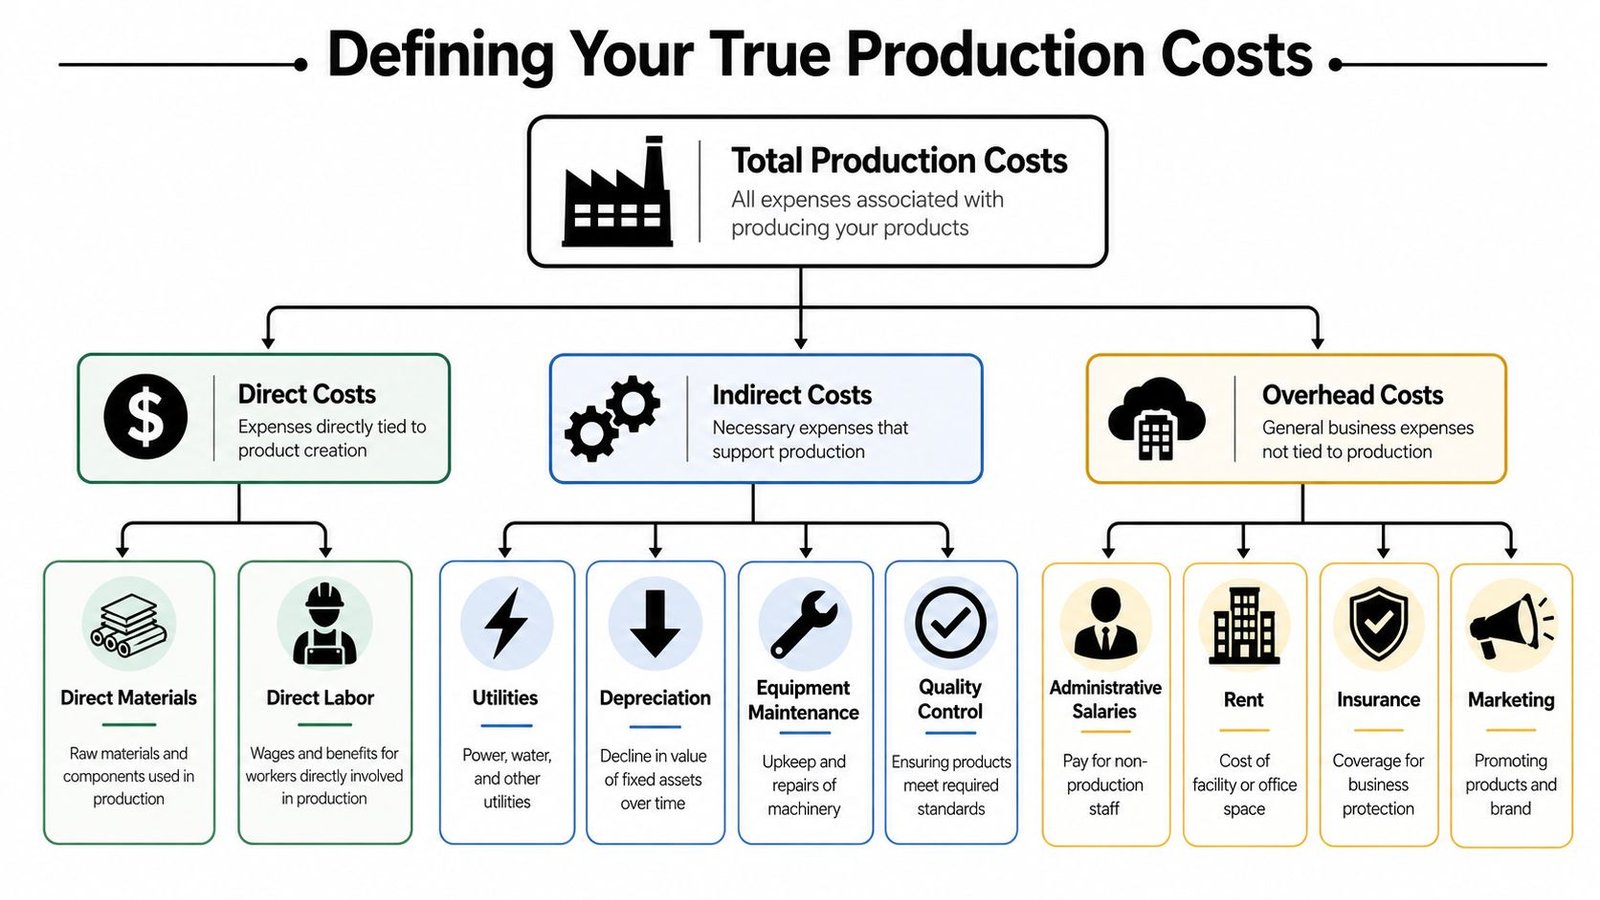
Start with the classic cost structure, but define each bucket the way the factory runs.
- Direct materials: Raw materials, bought-out parts, labels, packaging shipped with the unit, single-use consumables, and lot-controlled items consumed by the product.
- Direct labor: Operator build time, setup, loading and unloading, manual inspection, line-side material handling, and any routine in-process action required to release the unit to the next step.
- Manufacturing overhead: Utilities, maintenance, depreciation, supervisors, production support, environmental controls, calibration, and shared factory costs that keep the process running.
Those three buckets are standard. The problem is usually what gets excluded from them.
Cost categories that usually get missed
In regulated and semi-automated environments, hidden cost sits in support effort and process friction. That is where many automation projects create value, especially when a full lights-out system is not the right fit.
Include these categories before you call the baseline complete:
- Documentation labor: Batch records, device history records, reconciliation, traceability confirmation, label checks, and signoffs.
- Scrap and rework handling: Material loss, segregation, troubleshooting support, retesting, extra handling, and the labor tied to disposition.
- Quality effort tied to routine production: Line clearance, start-up verification, in-process checks, sampling support, and record review that happens every batch or every shift.
- Manual-process instability: Frequent adjustments, fixture wear, nuisance stops, sensor cleaning, temporary fixes, and technician support needed to keep output stable.
- Changeover and cleaning: Product switchovers, line setup verification, tool change, room prep, and sanitation or clearance steps required by the process.
- Waiting and queue effects: Operators standing by for QA release, maintenance response, material issue, or shared equipment access.
These items often point directly to automation opportunities. A semi-automated cell may not cut total headcount much, but it can reduce touches, review burden, minor stops, and deviation risk. That changes total conversion cost in a way a labor-only comparison will miss. Teams looking for practical ways to find those savings should also review these methods to reduce production costs without guessing.
The costing method matters too. Use one allocation logic and keep it stable over time. If one month assigns support cost by labor hours and the next month assigns it by machine hours, the trend becomes hard to trust. Finance may accept the report, but engineering and operations will not use it to make decisions.
The costing method should fit the operating model, not the ERP default.
For automation work, I separate routine production support from event-driven quality cost. Routine support belongs in the baseline because the process needs it to run. Event-driven investigations, major deviations, and one-off excursions should be tracked separately unless they happen often enough to represent normal operation. That distinction matters in GMP sites. It prevents teams from hiding chronic process weakness inside general overhead, and it prevents one bad month from distorting the business case.
Use a practical review before freezing the baseline:
- Map the full production path: Receiving, staging, setup, processing, inspection, release, packing, and handoff to finished goods.
- List every role that touches the order: Operators, material handlers, technicians, QA, maintenance, supervisors, and warehouse support.
- Assign support work by frequency: Per unit, per batch, per shift, per changeover, or per week.
- Separate recurring cost from exception cost: Baseline the normal process first, then track abnormal events in a different bucket.
- Mark which costs automation can change: Labor, scrap, review time, changeover effort, downtime, documentation load, or floor space use.
Done properly, this step does more than clean up the cost sheet. It shows where a right-sized automation investment can remove cost from the process, not just move it from labor to depreciation.
Calculating Your Baseline Cost Per Unit
Once the cost categories are defined, the next challenge is turning plant data into a baseline that people trust. At this stage, many teams lose credibility. They use standard routings no one updates, estimated labor that ignores waiting, or overhead rates that don't reflect how the line runs.

Build the as-is data set
For a practical production cost analysis, pull data from the systems and records that reflect reality closest to the work.
- ERP or MRP records: Material issues, BOM structure, purchase costs, inventory movements, and production order history.
- Machine logs and downtime records: Manual and semi-automated lines still generate useful events, especially around stops, resets, and changeovers.
- Time tracking and staffing schedules: You need actual labor deployment, not just planned headcount.
- Quality records: Rejects, rework flows, hold reasons, and review effort often change the economics more than cycle time does.
- Maintenance logs: Repeated interventions usually signal process instability that a redesigned cell may remove.
Then build the baseline in layers.
- Start with total good units produced in the reporting period. Use the same reporting basis across products and periods.
- Add direct material consumed for those good units. Exclude theoretical BOM-only assumptions if actual usage differs.
- Add direct labor tied to running and supporting the process. Include setup and in-process checks if they occur as part of standard production.
- Allocate manufacturing overhead using one consistent driver. Machine hours, direct labor hours, or activity drivers can all work if you stay consistent.
- Divide total assigned cost by good units transferred out. This gives you a baseline cost per unit for the as-is state.
If you're trying to improve plant economics, that baseline should connect to the shop floor, not live only in finance. Teams that want practical ideas for removing waste often pair this work with methods to reduce production costs in day-to-day operations.
A practical medical device assembly example
Take a semi-automated medical device assembly process with manual loading, fixture-assisted joining, visual inspection, label verification, and final pack-out. The product moves through several controlled steps, and operators spend part of the shift waiting for confirmations, handling documentation, and segregating exceptions.
Your baseline model might assign costs like this:
| Baseline input | What to include |
|---|---|
| Material cost | Components, labels, packaging, consumables |
| Labor cost | Assembly touches, inspection, setup, record completion |
| Overhead cost | Utilities, maintenance, supervision, equipment support |
| Quality support cost | Routine in-process checks and release support |
| Loss cost | Scrap, rework effort, and nonconformance handling tied to normal operations |
The point isn't to create a perfect spreadsheet. The point is to build a model that captures the actual cost of producing one good unit under current conditions.
A baseline also needs context. If one shift runs smoothly and another struggles with missing components or frequent micro-stops, average cost per unit may hide the actual opportunity. In those cases, I'll often calculate by product family, shift, or line segment first, then roll up only after the pattern is clear.
Use outlier checks before you trust the model
Modern manufacturing cost analysis goes beyond rollups. One published method recommends plotting estimated component cost against finished weight using a uniform batch size, then flagging parts that sit more than one standard deviation above the best-fit line as potential inefficiencies, as described in this cost analysis approach for identifying expensive parts and redesign opportunities. That's useful when you suspect one component, fixture choice, or process assumption is distorting the bigger picture.
Before you model automation, identify the parts and process steps that are already cost outliers. Otherwise you may automate the wrong problem.
This walkthrough is a useful companion if you want a visual refresher on how unit-cost logic is built in practice.
Once the as-is baseline is reliable, you're no longer debating opinions. You're comparing a current operating model against a future one using a common cost language that operations, quality, engineering, and finance can all work with.
Modeling the Financial Impact of Automation
Production cost analysis takes on a forward-looking nature. The question isn't whether automation is attractive in theory. The question is whether a specific semi-automated design changes the cost structure enough to justify the investment without creating new constraints in validation, flexibility, maintenance, or staffing.
What changes in a semi-automated future state
A useful to-be model doesn't assume that labor disappears. It reallocates work.
In a semi-automated medical device assembly cell, operators may still load components, verify lot status, clear minor faults, and perform controlled inspections. What changes is the consistency of the joining step, the repeatability of positioning, the reduction in handling, and the discipline of the sequence. That can lower rework exposure, reduce manual variation, and make output more predictable.
I usually test the future state against these cost drivers:
- Direct labor shift: Fewer manual touches per unit, but sometimes more technician support or structured setup.
- Throughput behavior: Higher sustained output if bottlenecks and waiting are removed.
- Quality cost movement: Better repeatability may reduce routine rework and exception handling.
- Overhead changes: New equipment adds depreciation, maintenance planning, utilities demand, and spare parts requirements.
- Compliance effort: Depending on the design, documentation may become easier through integrated checks, or harder if the system adds validation complexity.
A lot of business cases fail because they count only labor savings and ignore new support costs. Others fail for the opposite reason. They load the future state with every possible overhead burden while leaving the current state artificially lean. Both mistakes make the model less credible.
Cost Per Unit Analysis As-Is vs To-Be with Automation
Use a side-by-side comparison that focuses on direction and driver logic. If you don't yet have validated financial assumptions, keep the table qualitative instead of forcing numbers.
| Cost Category | As-Is (Manual/Legacy) | To-Be (Semi-Automated) | Change |
|---|---|---|---|
| Direct materials | Stable component usage, but more exposure to handling loss and inconsistent application | More controlled presentation and joining may reduce material-related variation | Likely decreases or stabilizes |
| Direct labor | Higher operator touch time across assembly, inspection, and documentation | Fewer manual touches, more structured operator role | Usually decreases per good unit |
| Scrap and rework | Manual variation creates recurring exceptions | Better repeatability can reduce avoidable defects | Often decreases |
| Quality support | More in-process checking to compensate for variation | Shifts toward confirmation of controlled process performance | May decrease or change form |
| Maintenance | Lower equipment complexity, but more manual adjustment and ad hoc fixes | Higher planned maintenance need, lower dependence on repeated operator correction | Mixed, often more predictable |
| Utilities and equipment overhead | Lower equipment load, but inefficiency hidden in labor and losses | Added machine-related overhead with better process control | May increase in one line item while total unit cost falls |
| Documentation and traceability effort | Manual entries and review steps create administrative burden | Integrated checks and guided sequencing can reduce manual burden if designed well | Often decreases |
| Cost per good unit | Driven by labor intensity and variability | Driven by a more controlled mix of labor and equipment cost | Should improve if the design targets the true bottleneck |
The most useful future-state model is not the most optimistic one. It's the one that survives scrutiny from production, quality, maintenance, and finance in the same room.
Where teams usually overstate savings
The common blind spot is assuming every cycle-time improvement becomes financial benefit. It doesn't. If upstream kitting still starves the cell, if downstream packaging still queues, or if QA release timing still holds shipments, the line won't convert technical speed into economic gain.
Another blind spot is volatile overhead. A major gap in many cost guides is how to model fast-moving energy and carbon costs, especially when they shift faster than material prices and can change which product lines become unprofitable first, as noted in this discussion of production costs, real-time tracking, and volatile energy inputs. In energy-intensive processes, your to-be model should test whether the semi-automated concept raises electricity demand at the same time it lowers labor and scrap. Sometimes that trade is still favorable. Sometimes it changes the preferred design.
A strong automation model asks which costs move, which costs stay fixed, and which costs simply shift from labor into overhead.
That's why semi-automation often wins in practice. It can target the unstable or labor-heavy portion of the process without forcing the entire line into a rigid architecture that's expensive to validate or hard to adapt across product variants.
Building a Bulletproof Business Case for Investment
An operations team may agree with your model and still lose the capital request. Approval usually depends on whether you can translate shop-floor improvement into financial language that leadership can evaluate against other projects.
Translate the model into executive language
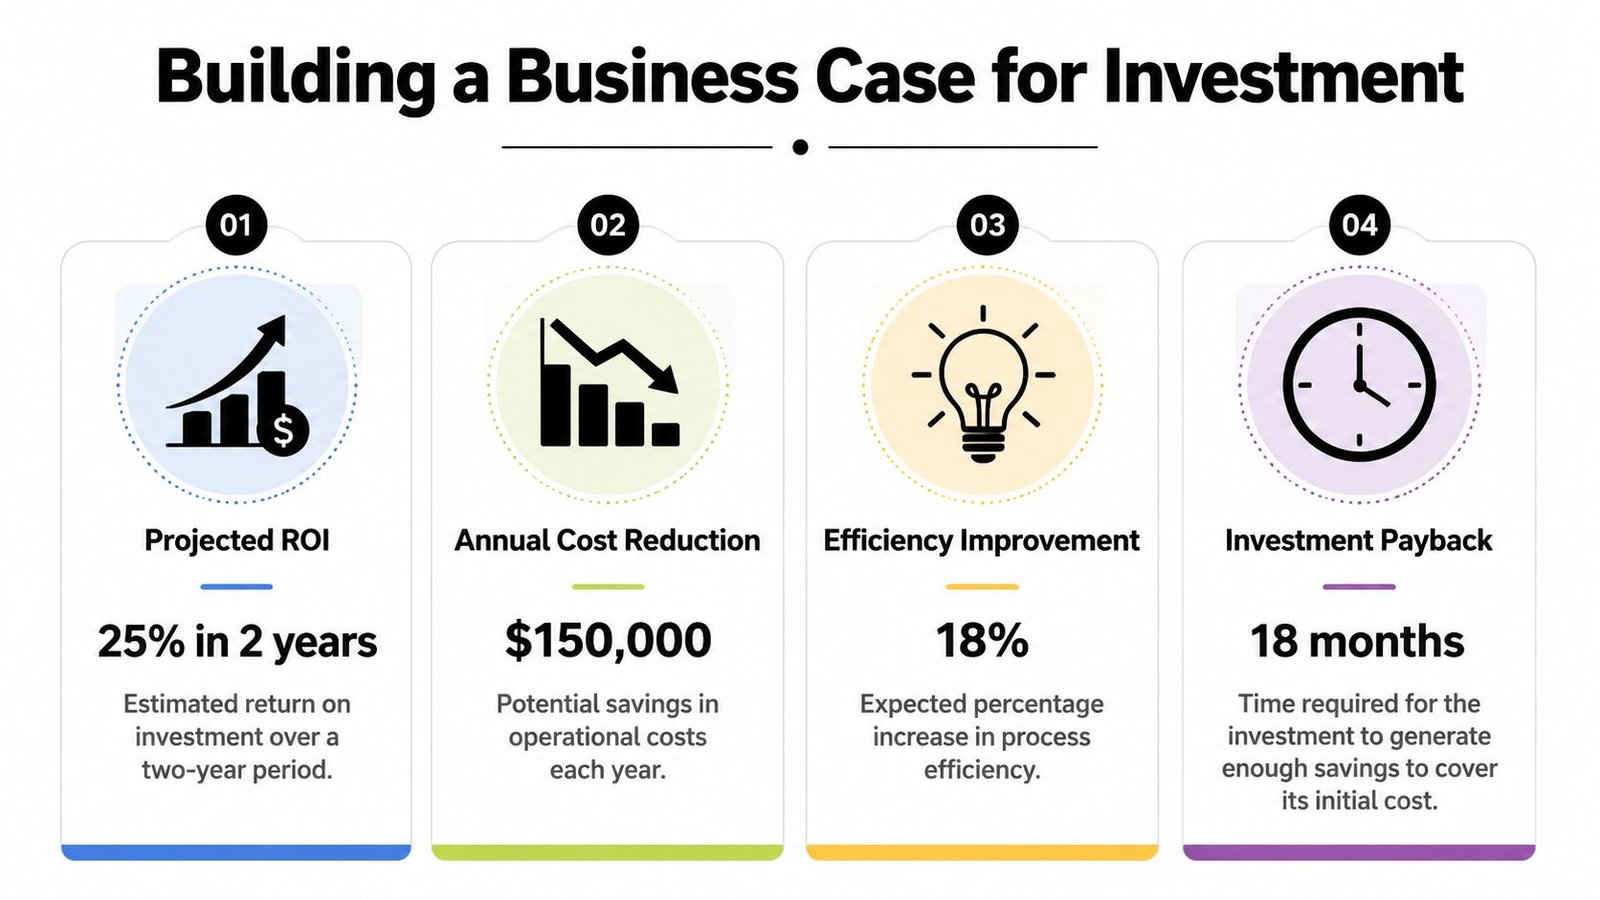
The core outputs are familiar. ROI, payback period, and NPV tell management whether the project is worth funding, how quickly it may recover the investment, and how it compares with other uses of capital. The math itself is standard. The harder part is defining cash flows that are grounded in operations rather than padded by assumptions.
Use the as-is and to-be models to build the financial case this way:
- Initial investment: Equipment, tooling, controls, installation, integration, validation support, training, and startup disruption.
- Recurring savings: Lower direct labor per good unit, reduced scrap and rework, fewer manual support tasks, and more stable throughput.
- Recurring additions: Maintenance, spare parts, utilities, calibration, software support, and any extra technical oversight.
- Strategic value not captured by direct savings: Better GMP control, easier traceability, safer operator interaction, and improved ability to scale.
When the discussion moves beyond one production line, a modeling tool can help frame the economics. A practical starting point is an automation ROI calculator built for manufacturing investment decisions.
What executives usually want to know is simple:
| Executive question | What your model should answer |
|---|---|
| Why this project now | Which current costs are materially limiting margin, output, or quality |
| Why this level of automation | Why semi-automation fits better than manual expansion or full automation |
| What could weaken the return | Which assumptions are most sensitive |
| What happens if demand changes | Whether the design still works at lower or mixed production volumes |
Stress test the assumptions
A business case becomes much stronger when you show where it could be wrong. Sensitivity analysis is the discipline of changing one assumption at a time and seeing how the economics respond. That means testing lower throughput gain, slower ramp-up, different staffing patterns, or higher support cost.
Volatile inputs deserve special attention. Energy and carbon-related costs can move faster than material prices, so an advanced production cost analysis should test which product lines lose profitability first under those conditions, as discussed earlier from the external guidance on manufacturing cost volatility. If the proposed cell increases power demand but removes rework and waiting, management needs to see both sides of that trade.
Don't present one beautiful scenario. Present a base case, a conservative case, and an upside case based on real operating constraints.
That approach changes the tone of the meeting. Instead of defending a fragile forecast, you're showing that the investment still makes sense across a reasonable range of outcomes. That's what makes a capital request hard to dismiss.
Turn Your Analysis into a Competitive Advantage
A good production cost analysis should change decisions on the factory floor, not just tidy up a finance review. The teams that get value from it use it to choose where automation belongs, where redesign will pay back faster, and where manual work should stay because flexibility matters more than speed.
That matters even more in GMP-regulated production. A low-cost concept that adds validation burden, line clearance risk, or cleaning complexity can erase the apparent savings very quickly. In those cases, the better answer is often a semi-automated cell that removes repetitive manual handling while keeping changeover, documentation, and operator intervention under control.
The quality of the method matters as much as the output. If one product family is costed with clean labor standards and another with rough averages, the comparison is weak. If engineering only sees the numbers after finance closes the analysis, the team is too late to correct a bad equipment concept or an unrealistic cycle-time assumption. As noted earlier, consistent costing methods and cross-functional visibility are what make the analysis usable for investment decisions.
The strongest teams usually do four things well:
- Keep one costing logic across periods and product families. That makes trend and margin comparisons credible.
- Bring engineering in before the concept is fixed. Cost, layout, maintenance access, and validation effort should be reviewed together.
- Model the future state with operating reality included. Product mix, ramp-up losses, operator capability, preventive maintenance, floor space, and GMP controls all affect return.
- Choose the level of automation that fits the process. In many SEA projects, fixtures, guided handling, poka-yoke, and semi-automated stations produce a better return than a fully automated line.
Many proposals fail at this point. The baseline is incomplete, so the savings look smaller than they are. Or the automation concept targets the wrong problem, such as replacing labor when the bigger loss is truly waiting time, yield loss, or batch release delay.
Fix those two issues first. The analysis becomes more than a justification document. It becomes a way to find margin, protect capacity, and make better capital decisions before competitors do.
System Engineering & Automation helps manufacturers turn production cost analysis into practical action with custom automation and engineering solutions from SEA. If you're evaluating a semi-automated workstation, a GMP-aware assembly upgrade, or a broader line optimization project, SEA can support the process from early concept and cost justification through design, build, installation, and commissioning.