
An RFQ lands for a semi-automatic assembly cell, and the proposal lists a 45-second cycle time. Someone in the review meeting asks whether that's fast enough. Nobody can answer cleanly, because the takt time on the whiteboard was calculated for last year's product mix, and the supplier's number came from a spreadsheet that divided weekly demand by a single shift's hours.
That's the usual state of things. The division behind takt is trivial. The decisions it feeds are not: how much automation to buy, how many operators to staff, whether a changeover project beats a second press. Getting a number you can trust out of your own shift takes twenty minutes. Keeping it trustworthy takes a written convention and a recalculation trigger agreed in advance. This is the working version of the takt time calculation, with the arithmetic, the conventions that move it, and the ways it gets misread.
Table of Contents
- Takt Time Formula With a Worked Example
- How to Calculate Takt Time in Four Steps
- What Takt Time Versus Cycle Time Tells You
- Which Downtime Belongs in the Denominator
- Calculating Takt for Mixed Models and Shifting Demand
- Takt Time in Regulated Medical Device Lines
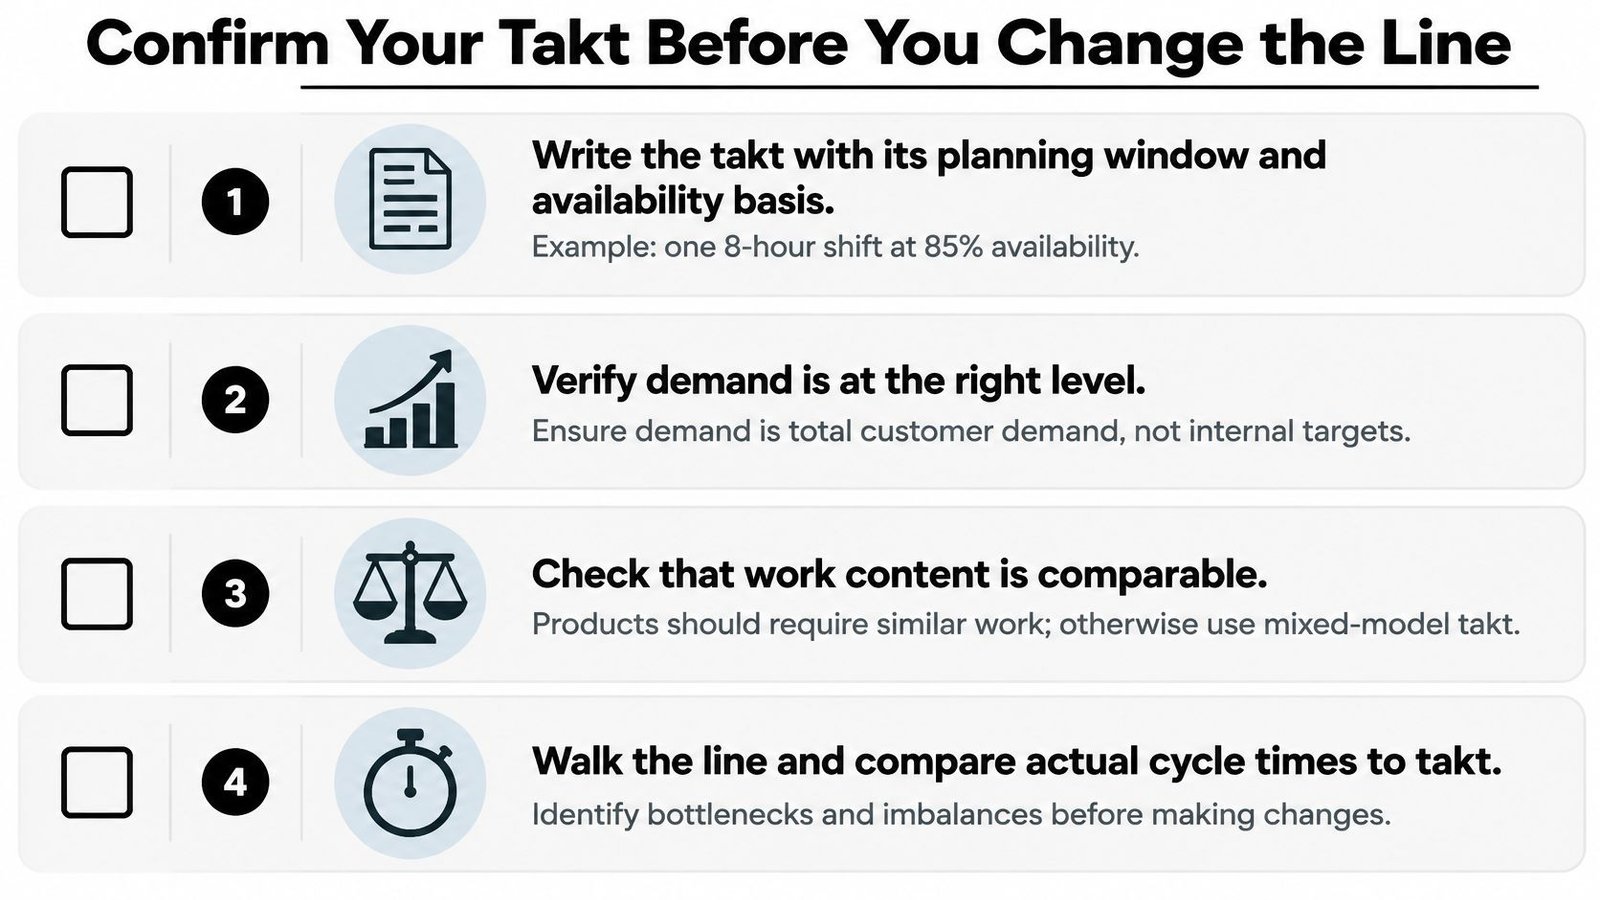
- Confirm Your Takt Before You Change the Line
Takt Time Formula With a Worked Example
The formula is one division. Takt time = available production time ÷ required units, and the answer is expressed in seconds per unit, because seconds compare cleanly with a stopwatch at a station.
Take an 8-hour shift. Gross time is 28,800 seconds. A 15-minute break, a 20-minute meal and a 25-minute morning meeting come to 1,200 seconds, which leaves 27,600 seconds of net available time. Customer demand for that shift is 460 units. So 27,600 ÷ 460 = 60 seconds. One finished unit has to leave the line every minute, on average, for the shift's demand to ship on time.
Hold the shift constant and change one input at a time:
| Scenario | Available time (s) | Required units | Takt (s) |
|---|---|---|---|
| Full shift, 1,200 s breaks and meetings removed | 27,600 | 460 | 60 |
| Lower demand on the same shift | 27,600 | 300 | 92 |
| Higher demand on the same shift | 27,600 | 920 | 30 |
| 85% availability convention | 24,480 | 460 | 53.2 |
Demand does most of the moving. At 300 units the same shift stretches to 92 seconds per unit; at 920 units it compresses to 30. The availability convention moves it too. Count only 85% of the shift as available production time, a common way to absorb breaks, meetings and short expected interruptions, and 24,480 ÷ 460 gives a 53.2-second target. Same plant, same month, two numbers a buyer would treat as interchangeable.
Before dividing, put both inputs in the same unit. An 8-hour shift is 28,800 seconds, not 8 hours and not 480 minutes, and the demand figure has to be what customers ordered for that window, not the internal target the schedule was built to.
Takt is a required pace set by the customer. It says nothing about machine capability. A press rated at 20 seconds per stroke can sit happily on a line with a 60-second takt, while a station designed around 45 seconds will miss a 30-second takt every shift.
The check to run this week: divide your net available seconds by this week's actual customer demand, then write the answer beside the output rate the line achieves today. If the achieved rate needs a longer interval than the takt, you've found the reason before any capital is committed.
How to Calculate Takt Time in Four Steps
The four steps hold whether you run a manual bench, a semi-automatic cell or a validated medical-device line. What changes between them is the list of things you subtract, not the order of operations.
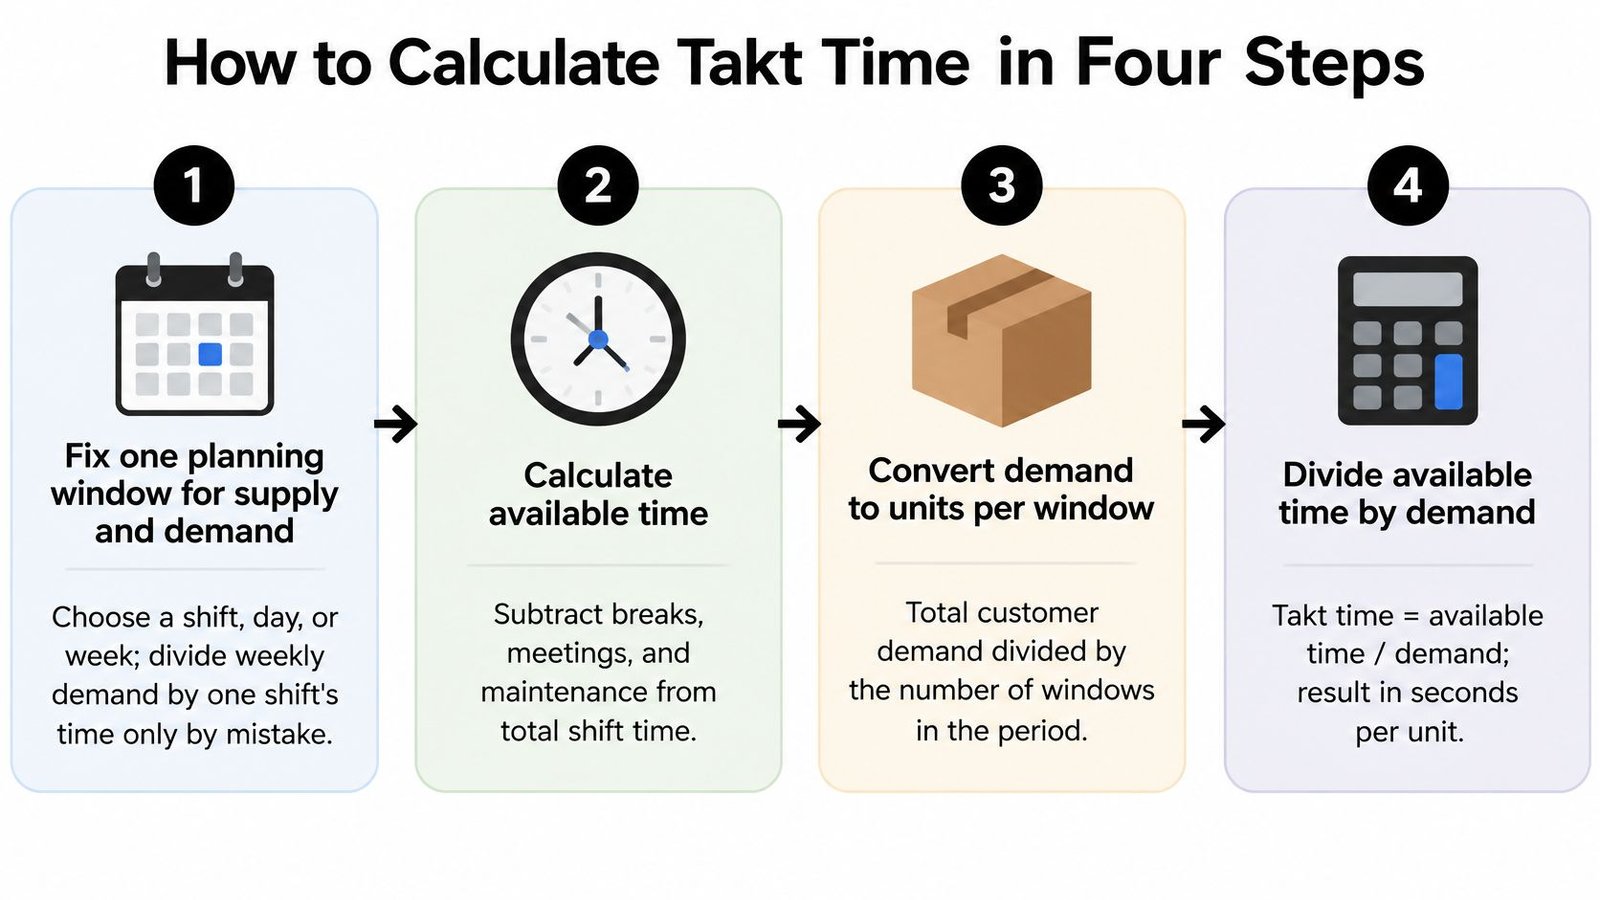
Fix one planning window for both supply and demand. Choose a shift, a day or a week, then use it on both sides of the division. Dividing weekly demand by a single shift's time is the most common slip, and the Lean Institute Brazil guide to takt time treats period matching as a critical control, because a mismatched window produces a target that is mathematically valid and operationally useless.
Convert gross scheduled time into net available time. Subtract planned breaks, meals, meetings, maintenance and every other scheduled non-production period. Calendar time is never the starting point. A plant doesn't produce through lunch, and it doesn't produce through a scheduled line clearance either.
Express both values in the same unit, preferably seconds. Eight hours becomes 28,800 seconds, a 30-minute changeover becomes 1,800, and a demand of 460 units stays 460. Mixing hours with minutes is the second most common failure, and it survives every sanity check because the arithmetic still runs.
Divide, then multiply back. 27,600 ÷ 460 = 60 seconds. Multiply 60 by 460 and you get 27,600 back. If the multiplication doesn't return your net time, an input was in the wrong unit or the wrong window.
On regulated and semi-automated lines the subtraction list grows. GMP-aware time models have to separate planned sterilization, line clearance, inspection and validated changeover from productive processing, because leaving them out systematically overstates capacity. A sterilizer cycle that runs every batch isn't a surprise loss. It's planned non-production, and it belongs in the denominator before the figure reaches a supplier.
The walkthrough below runs the same arithmetic on a shift, with the subtraction step shown explicitly:
Then write the result where the line can see it, with three things beside it: the date, the planning window and the availability convention. A takt of 60 seconds means nothing to the next supervisor unless the board also says 460 units per 8-hour shift, minus 1,200 seconds of planned stoppage.
What Takt Time Versus Cycle Time Tells You
The comparison that matters is between takt and the cycle time a station achieves, and the usual version of it is wrong. Holding takt against one stopwatch reading of one station tells you what happened during that cycle, not what the station can hold across a shift.
Balancing work wants the observed distribution. The Plazuno analysis of takt time and cycle time recommends comparing each operation's cycle-time distribution with takt, not a single observation, and folding quality checks, replenishment and normal minor losses into the work content before the comparison is made. Strip those out and every station looks faster than it is.
Takt is the pace the customer requires. Cycle time is what the process delivers. A line's capacity is set by the station with the longest cycle relative to takt, so the average across stations is a comfort rather than a fact.
| Condition | What it means | First action |
|---|---|---|
| Cycle time below takt | Station has spare capacity | Check utilization and consider combining tasks or cross-training |
| Cycle time equal to takt | Balanced, but no buffer for losses | Add a variability allowance before committing to the rate |
| Cycle time above takt | Demand cannot be met at the current method | Add capacity, staffing, a method change or equipment on the constraint |
The middle row is the one that hurts. Equal cycle time and takt look balanced on a spreadsheet and leave nothing for a jammed feeder, a misfeed or a quality hold, so the first bad hour of the shift puts the day behind. Comfortable loading sits below takt, with the gap sized to the losses the process has.
Four failure modes account for most bad readings:
- Forecast or installed capacity instead of customer demand. A machine's nameplate rating is not a demand signal.
- Ignoring demand variation. A long-run average hides peak weeks and creates shortages exactly when they cost most.
- Confusing takt with cycle time. One is a target, the other is a measurement, and swapping them turns a planning tool into a performance score nobody can hit.
- Balancing to an unadjusted takt. If real availability losses aren't in the model, every station is set too slow for the week it will have.
Simulation research describes takt as the theoretical rate required to achieve planned daily throughput, which is a precise way of saying a favorable quotient proves a target exists, not that your line can hold it. Cycle time is the number you control, and a focused effort to reduce cycle time on the constraint usually pays faster than another round of arithmetic.
Which Downtime Belongs in the Denominator
Same shift, same 460 units, two defensible conventions, and the target moves from 60 seconds to 53.2. That is almost seven seconds per unit and roughly 13% more output from identical equipment. On a line where one more station or one more operator is the next decision, 13% is the decision.
The conventions differ on what counts as available. The OEE.com explanation of takt time and cycle time defines available production time as the period when the process is expected to run, including budgeted downtime and excluding planned stop time such as changeovers. A recent manufacturing study took a different route and used 85% of a full shift as available time to cover breaks, meetings, ergonomic exercises and other expected interruptions. Neither is dishonest. They answer different questions.
| Downtime type | Subtract from available time? | Effect on customer takt | Where it belongs |
|---|---|---|---|
| Planned breaks and meals | Yes | Lowers takt | Available time |
| Scheduled changeovers | Yes | Lowers takt | Available time as a planned stop |
| Preventive maintenance | Yes | Lowers takt | Available time |
| Unplanned breakdowns | No | None | Effective capacity and buffer |
| Quality holds and rework | No | None | Effective capacity and yield |
| Expected microstops | No | None | Cycle-time allowance per station |
The sorting rule is simple to state. Anything you schedule and could move (a break, a planned changeover, a PM window, a validation hold) reduces the time available to make units, so it goes in the denominator. Anything unplanned (breakdowns, quality holds, rework, waiting for material) doesn't change what the customer ordered. It reduces the capacity you have, which is a different number and needs separate tracking.
Report two numbers, not one. Customer takt sets the delivery rhythm. Effective capacity, after availability, yield, changeover losses and validation holds, tells you whether a semi-automated cell can sustain that rhythm week after week.
Mixing the two is where capital goes wrong. Size equipment to the tighter figure with no buffer and the first bad week of unplanned downtime turns into missed orders. Ignore the tighter figure entirely and you approve a cell whose nominal cycle time was never achievable at real yield. Expected microstops belong in the cycle-time allowance at each station, not in the denominator, because they're a property of the process rather than the calendar.
Write the convention on the takt sheet next to the number. The tooling engineer quoting a cycle time and the planner building next week's schedule both need to know which stoppages were subtracted.
Calculating Takt for Mixed Models and Shifting Demand
Divide 27,600 seconds by 460 units and you get a single number, which is exactly where the formula stops being useful. The division assumes demand is stable and that each of the 460 units carries comparable work content. Neither holds on a real line with two or three variants.
Three pace numbers, not one
- Customer-demand takt: the long-run pace used for line design, staffing levels and equipment sizing. This one changes slowly and should be defended against day-to-day noise.
- Planning takt: a forecast-based pace for the weekly schedule. This one moves with the order book and belongs in planning conversations.
- Execution pace: the shift-board number the supervisor works to today, adjusted for the crew and the changeovers planned.
Collapsing all three into one figure is how plants end up changing the target every time an order moves.

Suppose the 460 units split two ways. Model A takes 300 units at 40 seconds of work content. Model B takes 160 units at 75 seconds. Total work content is 24,000 seconds across 460 units, an average of 52.2 seconds against a 60-second takt, or 87% loading.
| Model | Units | Work content (s per unit) |
|---|---|---|
| Model A | 300 | 40 |
| Model B | 160 | 75 |
| Total mix | 460 | 52.2 average |
| Loading against 60 s takt | 460 | 87% |
The average is comfortable and the sequence isn't. Every Model B unit carries 15 seconds more work than takt allows at the stations that touch it, so those stations need work shared with A, a buffer, or a different station design. That is the mixed-model problem in one line: the quotient balances the month and ignores the hour.
Research on high-variety, low-volume parts manufacturing shows takt can be based on the current order backlog, and that processing-time variability materially affects production-control performance, as the University of Groningen lean production control study sets out. In that kind of plant a single takt is impractical when daily demand or processing requirements keep moving, so pair the number with a variability allowance instead of treating the quotient as a guaranteed station cycle.
Then agree a recalculation band in advance. When weekly demand leaves the band, the takt is recalculated; when it doesn't, the target stays put and the line gets a stable pace. That discipline is worth more on a small or mid-sized semi-automated cell than designing around one nominal rate, and it feeds directly into production capacity planning rather than replacing it.
Takt Time in Regulated Medical Device Lines
On a regulated medical-device line, a shorter takt target can prompt changes to equipment, staffing, and work sequence. Those changes must preserve process control: a faster cycle is not an improvement if the process no longer reliably produces conforming devices.
The FDA overview of quality system regulation explains that a manufacturer's quality system should reflect device risk, manufacturing complexity, the scope of activities, and the organization's size and complexity. Processes must be developed, conducted, controlled, and monitored to ensure devices conform to specification. If later inspection and testing cannot fully verify a process's results, that process requires validation with a high degree of assurance. For a semi-automated station, define and monitor process parameters, ensure personnel are qualified, and document validation rather than relying on final inspection alone.
The FDA's quality system requirements incorporate ISO 13485 by reference into the cGMP requirements of 21 CFR Part 820, as described in the FDA overview of device regulation. Equipment changes intended to raise output therefore belong within the controlled quality system. On small and mid-sized lines, the available-time convention and the mixed-model basis can shift the calculated takt by several seconds per unit. That difference may change whether a line needs different staffing, shared work, or an automated operation, but the takt calculation alone does not establish that a changed process is validated.
The software part catches people out
Production-control logic, inspection software, and data capture can all affect production or quality-system processes. The FDA software validation guidance describes validation against an established protocol, with records covering user requirements, the protocol, acceptance criteria, test cases and results, and a summary confirming performance for intended use. A PLC change that shortens a cycle by four seconds can affect a validated system, so assess and document its effect rather than treating it as routine maintenance.
Before raising the pace on a regulated line, check that:
- Process documentation is current. Controlled documents specify the revised parameters, method, and cycle.
- Controls are tested. Acceptance criteria and test results cover the logic governing the new sequence.
- Operators are qualified. Training and qualification records cover the revised pace and tasks.
- Inspection remains effective. Detection performance holds at the higher rate, and faster handling does not weaken traceability.
- Ergonomic risk is reviewed. Assess changes to reach, repetition, and time available for safe intervention.
A faster takt is useful only when the process and its controls continue to meet requirements. If any of these checks is incomplete, resolve it before adopting the new pace.
Confirm Your Takt Before You Change the Line
Turn the calculation into a decision this week rather than a spreadsheet exercise.
- Write the takt with its basis. One 8-hour shift at 85% availability is a checkable statement; 53.2 seconds on its own is not.
- Confirm demand is customer demand. Total orders for the window, not the internal target the schedule was inflated to.
- Check that work content is comparable. If the units in the mix don't require similar work, use a weighted or mixed-model basis instead of the plain quotient.
- Walk the line against measured cycle-time spread. List the constraint and the buffer you're carrying against it, station by station.
Pace changes also change physical risk, and that review belongs in the same conversation. OSHA's 2024 work-related injury and illness summary recorded 550 robot-related incidents in the manufacturing sector, with 33% of the identified incidents requiring emergency-room treatment, and production workers plus installation, maintenance and repair workers the groups most often affected (OSHA 2024 injury and illness summary). Safeguarding, access control and maintenance procedures need to hold at the new rate, not the old one.
For small and mid-sized plants, the practical next step is usually a semi-automated cell rather than a fully automated line. Process automation can shorten cycle times, improve repeatability, reduce errors and rework, improve operator safety and produce better traceability data. Table-top semi-automatic systems let an operator load parts and start a cycle while automated components handle pressing, dispensing, testing or assembly, which suits plants planning a gradual move toward full automation. Testing the calculation against production line balancing before committing to fixtures or controls is cheaper than discovering the imbalance after commissioning.
System Engineering & Automation builds semi-automatic systems, custom tooling, fixtures and integrated controls for plants that need a takt they can hold, including GMP-aware work for medical-device manufacturers. We can take your shift figures, your availability convention and your mixed-model demand, and test them against station balance, yield and changeover reality before you commit to a fixture or a control package, with commissioning support and a one-year guarantee behind the build. Bring your numbers to System Engineering & Automation and we'll work through the calculation and the equipment decision together.