A line starts running, operators load the first batch, and the assembly that looked fine in CAD suddenly binds, leaks, or needs hand fitting. Each part is technically “within tolerance,” but the product still fails where it matters. That's the moment many teams realize the problem wasn't a bad operator or a weak supplier. It was unmanaged variation.
In real manufacturing, especially when you're moving from manual build to semi-automated production, tolerance stack up analysis is one of the fastest ways to prevent scrap, avoid repeated fixture changes, and protect line uptime. It turns drawing tolerances into something operational: a prediction of whether parts will fit, seal, align, and assemble at production speed.
For manufacturers trying to optimize production and services, this work has direct ROI. Better stack-up decisions lead to simpler fixtures, less forceful assembly, fewer line interruptions, and automation that matches the process instead of fighting it.
Table of Contents
- Why Your Parts Don't Fit The Cost of Ignoring Tolerances
- The Foundation of Tolerance Analysis
- Choosing Your Analysis Method Worst Case vs Statistical
- A Practical Workflow for Your First Tolerance Stack Up
- Advanced Considerations Beyond Basic Dimensions
- From Analysis to Action DFM Fixturing and Automation
- Build Better Products with Smarter Tolerancing
Why Your Parts Don't Fit The Cost of Ignoring Tolerances
A common production failure looks deceptively small. A housing sits slightly proud. A pin needs extra force. A seal works on one shift and leaks on another. Teams often react by adjusting the fixture, sorting parts, or asking machining to hold everything tighter. Those actions treat the symptom, not the cause.
The actual cause is usually a tolerance chain that nobody closed properly before release. One feature shifts another, that feature shifts a mating part, and by the time the assembly reaches final fit, the gap or interference is outside what the process can tolerate. On a manual station, a skilled operator may compensate. On a semi-automated line, the machine won't improvise. It jams, rejects, or builds risk into the next station.
Practical rule: If the line needs repeated adjustment to “make good parts fit,” the drawing stack likely carries more variation than the assembly can absorb.
This is why tolerance analysis belongs early and late in development, not just at drawing review. According to Simplexity's discussion of tolerance analysis timing, it must be conducted twice during the product lifecycle: first in the Architecture Phase using ROM estimations to confirm the concept is feasible from a tolerance standpoint, and again in the Detail Design Phase before release so parts can be purchased confidently without stack-related surprises.
What ignoring it costs in practice
- Scrap and rework: Parts can all pass inspection individually and still fail together.
- Delayed launches: The first build exposes issues that should have been caught before sourcing.
- Poor fixture decisions: Teams overbuild fixtures to force alignment instead of controlling actual sources of variation.
- Expensive tolerances in the wrong places: Purchasing pays for precision where it doesn't help function.
Managers usually feel this as cost pressure. Engineers feel it as fire-fighting. Both problems start the same way: no one translated design intent into assembly reality soon enough.
The Foundation of Tolerance Analysis
A simple way to understand tolerance stack up analysis is to think about stacking machined blocks. Each block meets its own drawing. None is “bad.” But once you stack several together, the total height can drift enough to miss a cover, misalign a hole, or preload a seal.
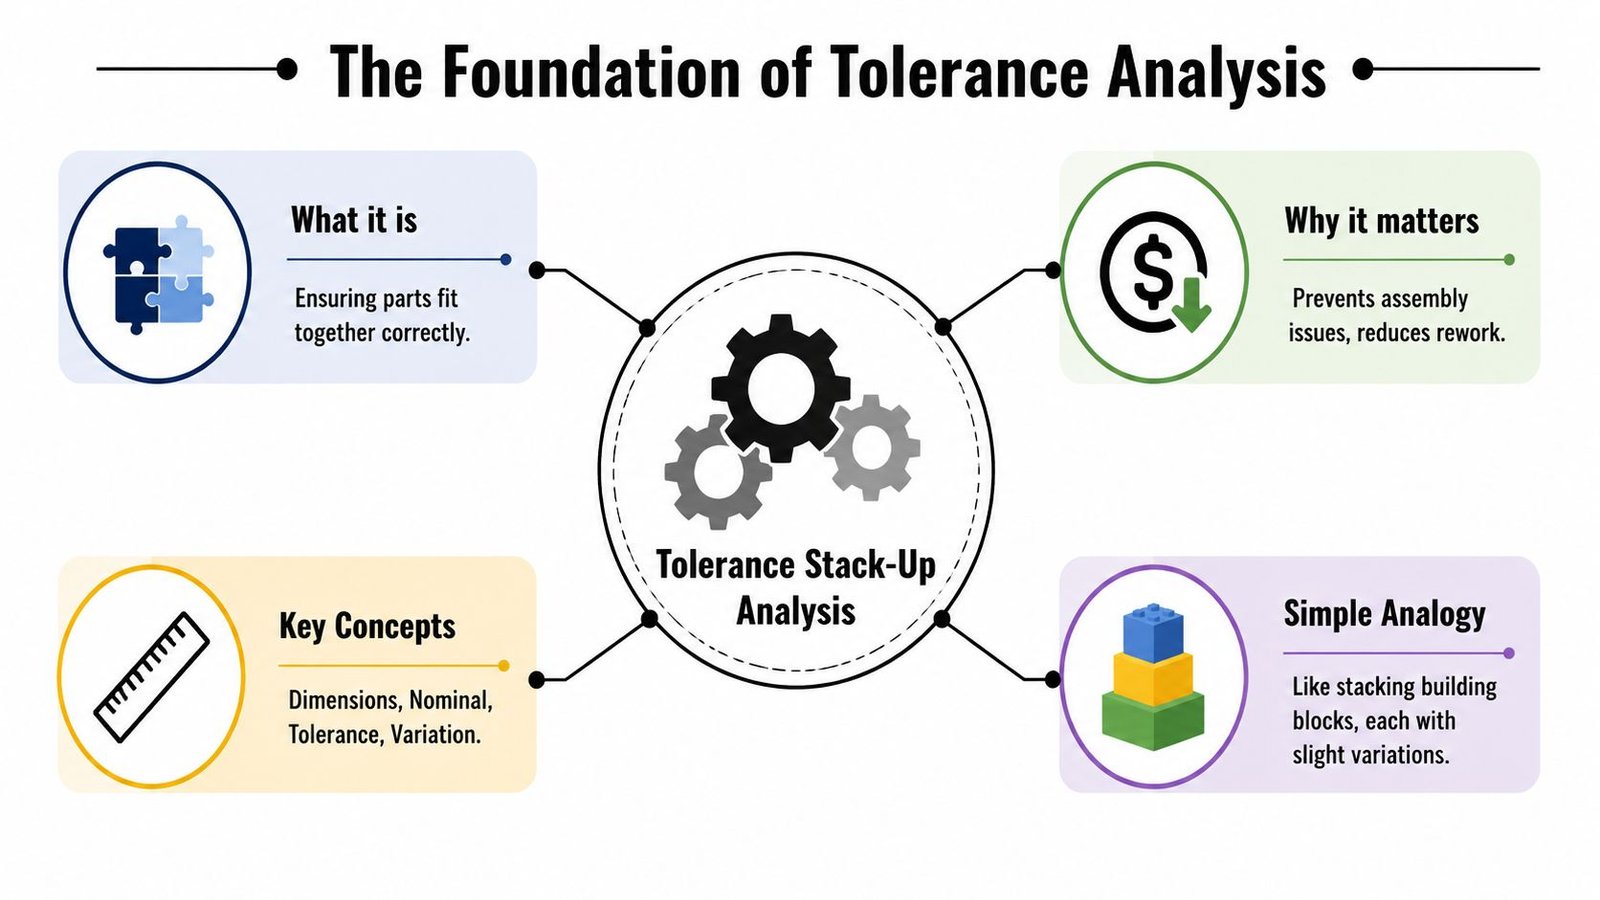
That's the core idea. Variation doesn't stay local. It accumulates through the assembly path.
For teams that are still refining product architecture, this is closely tied to the broader engineering design process. If fit, alignment, or sealing is critical, tolerance thinking has to sit beside functional design from the start.
Variation adds up whether you plan for it or not
Every dimension on a drawing has three practical parts:
| Term | What it means on the floor |
|---|---|
| Nominal | The target dimension |
| Tolerance | The allowed deviation from that target |
| Variation | What production actually delivers within that allowed band |
The trap is assuming that because each individual part is acceptable, the assembly must also be acceptable. That's not how assemblies behave. The final condition depends on the dimension chain, sometimes called a tolerance loop. That chain includes every feature that influences the final gap, location, or interference.
The dimension chain is the real assembly story
If a bracket locates a bushing, and the bushing locates a shaft, and the shaft sets the position of a sensor target, then those dimensions are connected whether the drawing team treats them that way or not.
A useful shop-floor habit is to ask one question: Which exact surfaces determine the final functional condition? Once you identify those surfaces, you can trace the stack between them.
Tolerance analysis isn't paperwork. It's a prediction of whether production variation will still allow the product to function.
A good chain has clear start and end points. It also uses actual assembly relationships, not convenient dimensions from separate drawing views. If the product assembles in one axis first and then seats on another datum, your loop should reflect that reality. Otherwise the analysis looks neat on paper and fails on the line.
When teams get this foundation right, later decisions about tolerances, fixtures, and automation become far more rational.
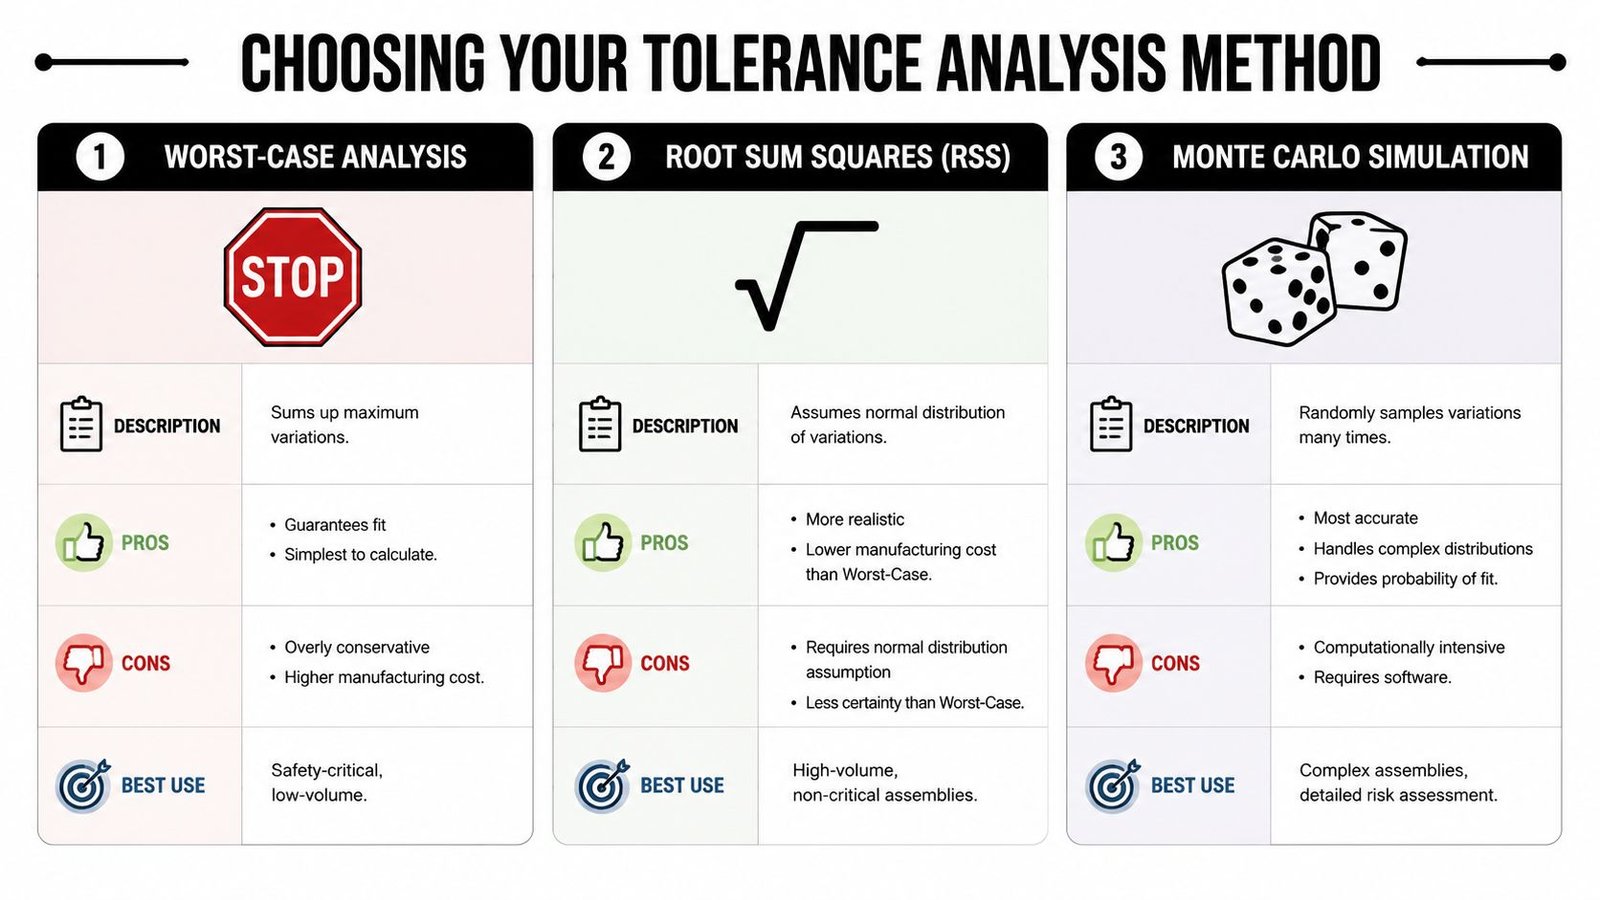
Choosing Your Analysis Method Worst Case vs Statistical
A stack-up method is a cost decision before it is a math decision. Choose too conservatively and machining, inspection, and supplier cost climb fast. Choose too loosely and the line starts compensating with shims, hand fitting, extra checks, or rejected assemblies.
In practice, the right method also changes with production stage. A prototype assembled by a senior technician can tolerate some manual adjustment. A semi-automated line in a GMP-aware environment usually cannot. Once fixtures, poka-yoke features, and cycle time targets enter the picture, tolerance analysis has to reflect how the process will run.
Worst-case analysis
Worst-case is the hard-limit method. It adds the contributors arithmetically using T_total = t₁ + t₂ + t₃ + … + tₙ, which assumes every feature lands at its least favorable limit at the same time. That makes it the safest starting point for assemblies where failure, rework, or field escape carries a high cost.
It is often the right choice for regulated products, one-way assemblies, bonded parts, or builds where post-assembly sorting is expensive. It also exposes weak concepts early. If the design only works when every supplier holds centerline performance, the design is not ready for production.
The trade-off is predictable. Worst-case usually pushes tighter part tolerances, more capable tooling, stricter incoming inspection, and higher piece price, as described in this tolerance stackup guide from MFG Solution.
RSS analysis
RSS, or Root Sum Squares, combines tolerances statistically with T_tot = √(T_1^2 + T_2^2 + … + T_n^2). It assumes the contributors vary independently and that extreme conditions do not all occur together in normal production.
That assumption fits many stable manufacturing processes better than worst-case. It often gives a tolerance budget you can machine, mold, or stamp at scale. This matters when the commercial target depends on standard tooling instead of custom high-precision operations.
RSS is useful only when the process supports it. If the line has drift, operator-dependent setup, unstable clamping, or a supplier with visible batch-to-batch shift, the statistical result can look cleaner than the factory reality. I have seen teams approve an RSS-based stack, then lose the savings because they had to add manual alignment stations and tighter fixtures to keep assembly yield up.
Monte Carlo simulation
Monte Carlo is the method to use when the stack behaves like production, not like a textbook example. It repeatedly samples dimensions from selected distributions and estimates likely assembly outcomes across many runs. That gives a yield view instead of a single tolerance number.
This is useful when the assembly includes several contributors, conditional fits, mixed processes, or non-symmetric distributions. It is also useful when form error starts to matter. A pin, bore, slot, or molded wall can pass size inspection and still assemble poorly because location, flatness, roundness, or warpage changes how parts seat in the fixture. A simple linear stack will not always catch that.
One practical caution. Monte Carlo is only as good as the input assumptions. If teams feed it drawing limits without checking actual process capability, the output looks precise but does not help production. The value comes when measured shop-floor data is used to shape the distributions and when geometric effects are represented accurately.
In one worked example, a statistical simulation is used to estimate assembly fallout and relate it to standard deviation assumptions, as shown in this video on statistical tolerancing and Monte Carlo analysis.
A quick visual summary helps before you choose a path.
How to choose in practice
Method selection should follow risk, process maturity, and how the assembly will be built.
Use worst-case for safety-related features, irreversible joins, validation-heavy products, and assemblies where jamming an automated station costs more than holding a tighter tolerance.
Use RSS when the contributors are numerous enough for statistical treatment to make sense, the process is stable, and you have evidence that variation is centered and repeatable.
Use Monte Carlo when the assembly includes interacting variables, geometric form effects, or production scenarios that change as volume ramps.
PatSnap highlights a common scale-up problem. Teams often struggle to switch methods as products move from development builds into higher-volume production, according to PatSnap's discussion of tolerance stack-up analysis methods. That gap matters because the analysis method influences fixture complexity, gauge strategy, operator content, and automation payback.
A practical rule works well on the factory side. Start conservative, then relax only when process data earns that decision. For prototypes, a worst-case pass can protect against obvious design mistakes. For pilot runs, compare worst-case and RSS and check the result against measured builds. For semi-automated lines, use Monte Carlo if yield, feeder behavior, insertion forces, or datum shift depend on more than basic size variation.
That approach keeps the analysis tied to ROI. Good tolerance work reduces scrap, avoids overbuilt tooling, and prevents automation from being designed around the wrong assumptions.
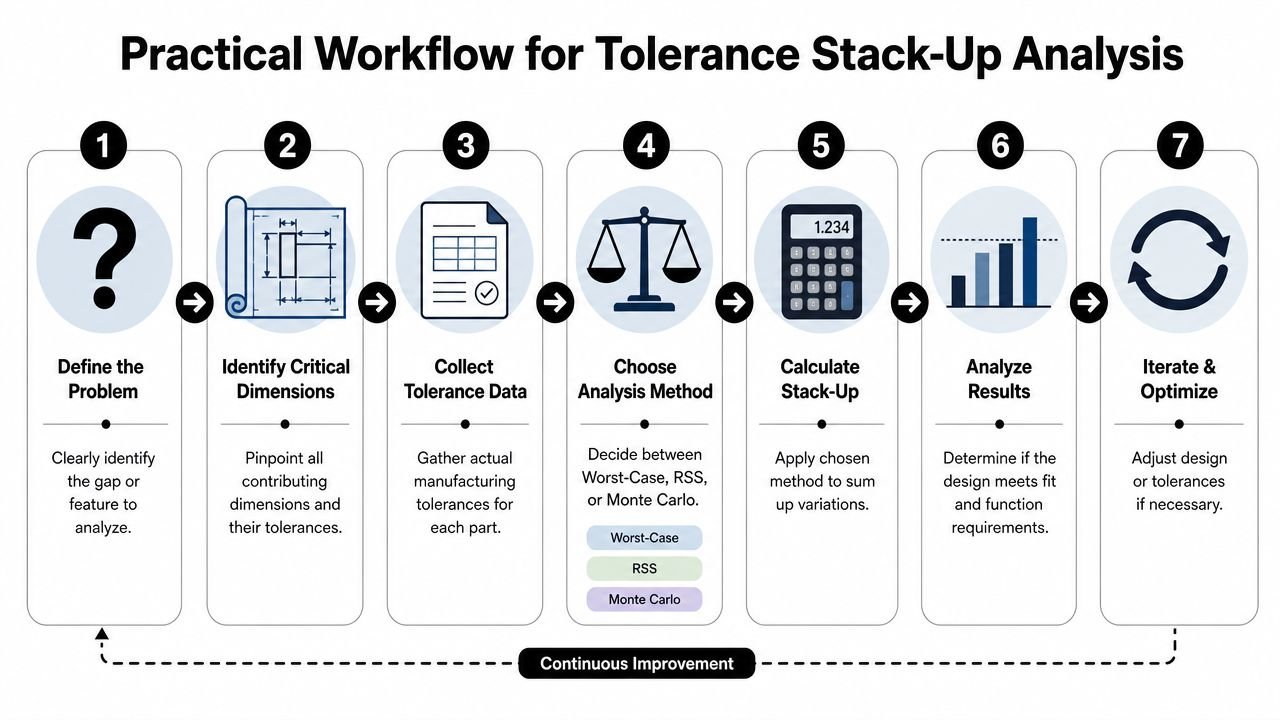
A Practical Workflow for Your First Tolerance Stack Up
A first stack-up usually starts after a build problem. The pilot lot assembles by hand, then the same parts start hanging up once a fixture, nest, or pick-and-place sequence fixes the part position more tightly. That is the right time to stop arguing from nominal CAD and map the actual tolerance loop.
Start with the assembly condition that matters
Choose one output that affects function or cycle time. Typical examples are end gap, insertion depth, connector offset, seal squeeze, or whether a part reaches a hard stop before the station times out.
Keep the first pass narrow. A single closed loop is easier to verify on the floor and easier to connect to cost.
Use this sequence:
- Define the requirement. Write the functional condition in plain language. Example: the pin seats fully without bottoming out, and insertion force stays within the station limit.
- Identify the loop. Trace the surfaces, datums, and dimensions that control that condition from one contact point to the next.
- Set the direction. Assign plus and minus signs so the stack reflects how the parts build.
- Record nominal and tolerance values. Use the released drawing values, or the values you plan to release after review.
- Run the calculation. Check worst-case first. Then add RSS or simulation if your process data supports it.
- Compare the result to production reality. Check assembly clearance, fixture repeatability, gauge resolution, and operator or robot approach path.
Build the loop with the process in mind
A basic linear stack is still a good starting point, but build it as if the parts will be assembled in a real cell, not on a whiteboard. Include the surfaces that locate the part in the fixture. Include any interface that can float, cock, or seat differently under clamp force. If one component is made by wire cutting or sinker work, tie the expected capability back to the process used for precision EDM machined parts instead of assuming the same variation as a milled feature.
For a quick manual check:
- Worst-case: add the absolute values of each tolerance in the chain.
- RSS: combine them using T_tot = √(T_1^2 + T_2^2 + … + T_n^2).
For critical features, add a reality check for process drift. As noted earlier, some teams include a 1.5 sigma mean shift when they review long-run behavior. That matters more once the job moves from prototype builds to a semi-automated line, where tool wear, thermal growth, lot changes, and setup resets can shift the process center over time.
A stack that only works with perfectly centered processes is a weak stack.
A simple review sheet helps keep the analysis tied to action:
| Item | What to record |
|---|---|
| Functional feature | Gap, interference, alignment, compression |
| Contributing dimensions | Every feature and contact surface in the loop |
| Method used | Worst-case, RSS, or simulation |
| Production assumptions | Process centering, drift risk, fixture location, operator influence |
| Follow-up action | Drawing change, fixture update, gauge plan, or process study |
Turn the result into a manufacturing decision
The calculation is only useful if it changes what gets built.
If worst-case misses the requirement by a wide margin, changing one tolerance usually will not fix the problem economically. The better answer is often a design change, a shorter loop, a different datum strategy, or a fixture that controls the part in the same way the final assembly sees it. If the stack is acceptable on paper but the station still jams, check the contacts, loading sequence, and how the part settles under clamp force. In GMP-aware production, that review also supports repeatability and documented rationale for the chosen controls.
Good first stack-ups produce clear next steps. Revise the print. Adjust the fixture. Add a gauge at the feature that predicts failure earlier. Or hold a tighter tolerance only where it buys yield, smoother automation, and less scrap.
Advanced Considerations Beyond Basic Dimensions
Basic one-dimensional analysis is useful, but many production problems don't come from size alone. They come from geometry.
Size can pass while the assembly still fails
A plate can meet thickness tolerance and still rock because of flatness. A shaft can meet diameter tolerance and still bind because mating features are not aligned in use. A sealing surface can measure “good” and still create leakage because waviness changes contact across the face.
Many simplified stack-up guides fall short here. Real-world data from medical device manufacturers shows that 30–40% of assembly mismatches stem from form errors in non-critical features, not dimension tolerances, according to Modus Advanced's discussion of tolerance stack-up gaps in product design.
That number matters because medical and GMP-aware environments often depend on repeatable fit, sealing, and controlled contact conditions. If your analysis assumes perfect flatness, perfect straightness, and perfect seating, you may end up over-tolerancing dimensions while missing the geometric condition that is the true driver of failure.
For precision components, especially EDM machined parts, this distinction becomes even more important because the process can hold fine features while the assembly still depends on how those features present and locate in real contact.
Standards matter but they are not the whole answer
ASME Y14.5 and ISO-based fit systems are essential because they define how size, position, and geometry should be specified. But compliance with the standard doesn't automatically mean the stack-up model matches the physical assembly.
Here are the mistakes that show up most often:
- Ignoring form on support features: A “non-critical” land or face still affects seating and orientation.
- Using ideal datums in analysis: The part on the machine doesn't contact ideal geometry. It contacts real surfaces.
- Treating semi-automated assembly like bench assembly: A machine inserts, locates, and clamps with less forgiveness than a skilled operator.
A part can be inside every size tolerance on the print and still be the reason the station won't run.
Once teams start thinking in real contact conditions instead of isolated dimensions, stack-up work gets much more valuable. It stops being a drawing exercise and becomes process engineering.
From Analysis to Action DFM Fixturing and Automation
A good tolerance report should change the way the product is made. If it doesn't, it's just documentation.
Use the analysis to shape the process
Start before metal is cut. According to Harvey Performance's best practices on tolerance stacking, beginning a tolerance stack-up analysis prior to machining helps verify that parts are achievable with current machine setups, which reduces scrapped parts and improves production efficiency.
That early timing affects several DFM decisions:
- Tolerance placement: Tighten the dimensions that control function. Relax the ones that only make inspection harder.
- Process selection: Choose machining, grinding, EDM, or secondary ops based on the features that dominate the stack.
- Datum strategy: Use locating schemes that reflect how the part sits in assembly, not just how it was easiest to dimension.
- Inspection planning: Measure the contributors that matter to the final fit, not every feature with equal intensity.
Where smart automation pays off
Practical ROI becomes apparent. If analysis shows a narrow assembly window, the fixture must control orientation, seating, and part presentation tightly enough to protect that window. If the stack is forgiving, the fixture can be simpler and less expensive. Automation should follow the variation budget, not the other way around.
A few direct examples:
| Analysis result | Better production response |
|---|---|
| Tight alignment stack | Add positive location, hard stops, and controlled insertion path |
| Seal compression sensitivity | Design nest support to stabilize the sealing face before joining |
| Variation driven by one dominant feature | Improve only that process or fixture, instead of tightening every drawing tolerance |
For many manufacturers, the strongest gains come from smart tooling and fixtures, not maximum automation. A well-designed fixture can absorb normal part variation, present components consistently, and reduce operator dependence without forcing a full line redesign.
The opposite approach doesn't work well. Teams sometimes add actuators, sensors, or force to push through a poor stack. That usually increases complexity while hiding the root cause. Better stack-up analysis lets you simplify the system. Simpler systems usually run longer, change over faster, and cost less to maintain.
Build Better Products with Smarter Tolerancing
The most useful thing about tolerance stack up analysis is that it connects design, machining, assembly, quality, and automation in one decision loop. It tells you where variation matters, where it doesn't, and what the process must control to build reliably.
For cost-conscious manufacturers, that matters more than academic precision. Better stack-up work reduces scrap, avoids expensive late design changes, and helps teams choose the right level of fixturing and automation for the actual product risk. It also keeps engineering effort focused on the few dimensions and geometric conditions that drive assembly performance.
The manufacturers that scale cleanly are rarely the ones with the tightest drawings everywhere. They're the ones that understand variation early, model it accurately, and build production methods around it.
If you're upgrading a manual process, planning a semi-automated cell, or trying to stop recurring fit-up problems before the next production run, System Engineering & Automation can help turn tolerance analysis into practical manufacturing improvements. SEA develops cost-effective automation, tooling, fixtures, and engineering solutions that improve quality, efficiency, and production reliability without overbuilding the process.