If you're looking for an automation ROI calculator, you're probably already dealing with a familiar problem. The process is too manual, labor is hard to stabilize, quality issues keep stealing engineering time, and every proposed fix gets challenged with the same question from finance: "Show me the payback."
That's where many organizations get stuck. The online calculators are usually too simple to survive a thorough capital review. They assume labor disappears cleanly, they miss implementation friction, and they rarely reflect the reality of semi-automated lines, regulated production, or staged deployment. A credible model has to match how manufacturing works.
The good news is that a solid automation ROI calculator doesn't need to be complicated for the sake of it. It needs to be honest. That means building from a clean baseline, capturing the full project cost, projecting gains conservatively, and presenting the result in a format a skeptical CFO can trust.
Table of Contents
- Laying the Foundation for a Credible ROI Model
- Quantifying the Full Spectrum of Investment Costs
- Projecting Realistic Gains Beyond Labor Savings
- Calculating the Key Financial Metrics That Matter
- Presenting Your Results for Stakeholder Approval
- Your Actionable ROI Calculator Template
Laying the Foundation for a Credible ROI Model
Generic ROI models fail in manufacturing because they start with the solution instead of the current state. Teams price the equipment, estimate labor savings, and call it a business case. Finance sees the gaps immediately.
A realistic automation ROI calculator starts with a baseline. That means documenting how the process performs today before anyone talks about a robot, fixture, conveyor, vision system, or operator interface. According to BP3's ROI guidance for process automation, a robust calculator should begin with a baseline assessment of current costs and process performance, then define measurable success criteria, because every handoff in a process can add 2-4 hours to completion time.

What belongs in the baseline
Start by mapping the process at the level where cost happens.
- Labor content: Include direct operator time, support labor, setup attention, and supervision tied to the process.
- Maintenance burden: Record recurring downtime calls, adjustments, spare part usage, and technician hours.
- Error correction: Capture rework, retesting, sorting, line-side troubleshooting, and paperwork caused by mistakes.
- Delay cost: Separate waiting time, queue time, and approval or transfer delays from true touch time.
That separation matters. If you lump everything into a single labor bucket, you can't show where automation will improve flow.
Practical rule: If the current state isn't measured cleanly, the future-state savings won't be trusted.
Define success in operational terms
Good ROI models don't just ask, "Will this reduce headcount?" In many plants, that isn't even the main value. The stronger question is whether the project improves a business constraint.
A useful success definition might include items like:
- Shorter cycle time through a bottleneck.
- Better repeatability at a quality-critical step.
- Less operator dependence on a hard-to-staff station.
- Lower disruption from manual handoffs.
- Easier validation of the process in regulated production.
If you're still deciding what form the solution should take, the right starting point is the production method itself, not the calculator. A custom machine, a semi-automatic station, a fixture set, or a smart manual aid can all produce a different financial outcome. That's why teams often start by reviewing automation systems design options before they lock the business case.
Baseline first, spreadsheet second
The strongest ROI cases usually come from simple discipline. Walk the line. Watch the operator. Time the actual process. Note the workarounds. Ask quality where the recurring escapes happen. Ask maintenance what fails repeatedly. Ask production where the queue builds.
That groundwork does two things. It improves the math, and it changes the conversation from "we want automation" to "we know exactly what problem we're paying to remove."
Quantifying the Full Spectrum of Investment Costs
A project looks inexpensive until the quote leaves engineering and starts collecting comments from operations, maintenance, quality, EHS, and finance. That is usually when the budget jumps.
An automation ROI calculator earns trust only if it prices the full installed system and the work required to put that system into production. A line item for equipment plus a rough installation allowance is not enough for a CFO review. It leaves out the costs that show up after capital is requested, when the team is already committed.
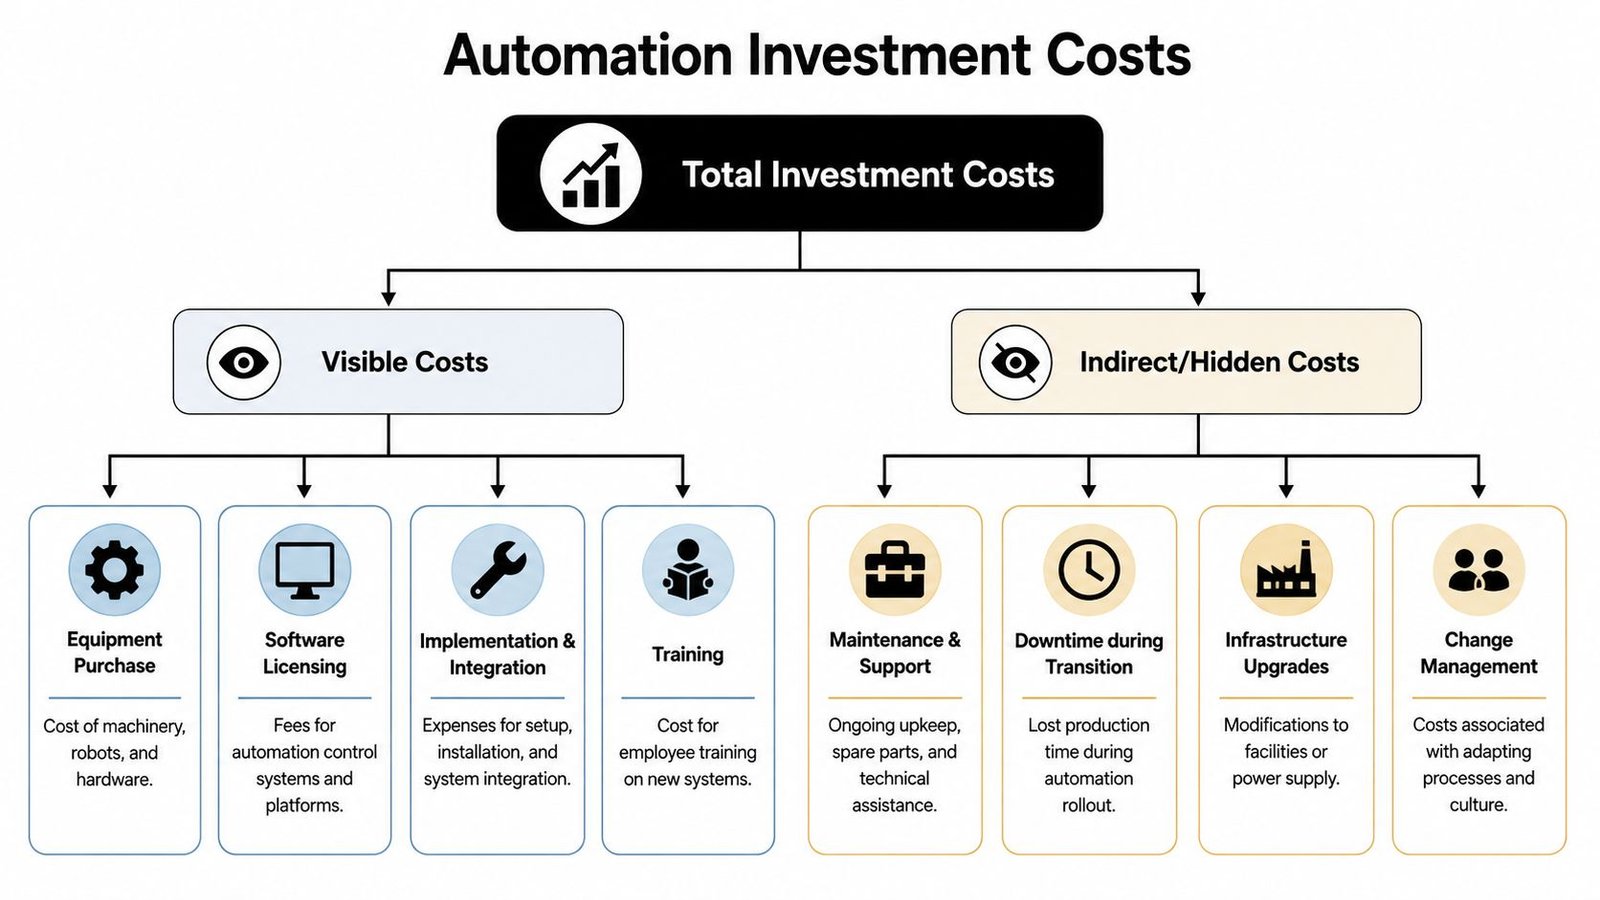
Visible costs are only the starting point
A usable cost model should capture what it takes to buy, integrate, launch, support, and, where required, validate the system. In practice, the missed items are rarely exotic. They are standard project tasks that get omitted because they sit in different budgets or belong to different departments.
Include costs such as:
| Cost area | What teams often miss |
|---|---|
| Equipment | Grippers, sensors, controls hardware, guarding, tooling, and interfaces |
| Engineering | Mechanical design, controls programming, documentation, debug time |
| Installation | Rigging, wiring, utilities, commissioning labor |
| Production impact | Lost output during cutover, ramp-up inefficiency, temporary workarounds |
| Training | Operators, maintenance, quality, supervisors |
| Facility changes | Floor prep, electrical drops, pneumatics, space changes, guarding updates |
| Validation | IQ/OQ/PQ-style activities, test protocols, re-validation where applicable |
Many spreadsheet models often fall short. They capture purchased parts but miss the labor and disruption around deployment.
The machine price is not the system price
SDC Automation's ROI guidance recommends treating the robot as only part of the total investment, with the base system often landing at roughly three times the robot cost, and rising further once installation extras are included. That is a useful screening rule, not a final estimate. It is helpful because it keeps early business cases from using the robot quote as a stand-in for the whole project.
A quoted robot, press, vision unit, or conveyor is just one layer. The complete investment includes controls integration, guarding, fixturing, safety review, electrical work, commissioning, documentation, spare parts, and the plant time needed to cut the system in.
Hidden costs usually arrive through support functions
Quality may need protocol development and test execution. Maintenance may ask for critical spares, PM instructions, and troubleshooting documentation. Operations may need temporary labor during startup. IT may require network segregation or historian connections. None of that is padding. It is part of making the asset usable.
For GMP-regulated production, the cost stack gets heavier. Validation planning, document control, change control, and re-validation after material or software changes can materially change the payback period. Those tasks should sit in the original model, not in a later “project support” bucket that appears after approval.
I usually separate the estimate into two categories because it exposes omissions quickly.
Direct project spend
- Equipment and controls
- Mechanical and electrical integration
- Software and licensing where applicable
- Installation and commissioning
Operational enabling cost
- Cutover downtime
- Training and qualification
- Validation and change control
- Support tooling, spare parts, and maintenance setup
That split also helps with stakeholder review. Engineering can check scope, operations can check startup impact, and finance can see which costs are one-time versus ongoing.
If the project involves a purpose-built system, estimate against the actual scope of custom automation machinery for manufacturing applications instead of assuming an off-the-shelf cost structure. The estimate gets better when the team prices the full operating solution, not just the machine on the drawing.
The projects that survive financial review are usually the ones with fewer surprises in year one. Conservative costing does not weaken the business case. It makes it believable.
Projecting Realistic Gains Beyond Labor Savings
A plant manager walks into the budget review with a calculator that shows a clean labor reduction and a fast payback. The CFO asks one question. "How many of those hours are removed from the operation?" If the answer is vague, the model loses credibility fast.
Labor is still part of the case, but it is rarely the whole case in manufacturing. A believable automation ROI calculator also accounts for throughput stability, scrap reduction, rework avoidance, changeover consistency, safety improvement, and schedule protection. Those gains matter because they affect output and margin, not just headcount. They also need tighter assumptions than the online calculators usually use.

Stop assuming every saved minute becomes a financial gain
For semi-automated stations, projected labor savings often overstate what the plant will capture in year one. Some operator work goes away. Some of it shifts to loading, exception handling, setup, replenishment, in-process checks, and recovery when the cell stops. The spreadsheet may show saved cycle time. Finance wants to know what portion turns into fewer paid hours, higher output, or avoided overtime.
That is the realization gap. I do not assign a fixed percentage unless the plant has historical data to support it. I ask the team to sort tasks into three buckets instead:
- Eliminated work: manual actions the system removes
- Reduced work: tasks that still happen, but take less time
- Shifted work: labor that moves to support, monitoring, inspection, or maintenance
That breakdown changes the discussion. It forces engineering and operations to state where human involvement remains, and it prevents a semi-automated process from being modeled like a lights-out cell.
A few questions usually expose inflated assumptions quickly:
- Which manual touches still happen every cycle?
- What exceptions require operator judgment?
- How often does the station stop for jams, misfeeds, or part variation?
- Who handles setup, replenishment, sanitation, or line clearance?
- If output rises, can the downstream process absorb it?
If an operator still owns recovery and judgment, count only the portion of labor the plant can actually remove or redeploy.
Model gains the plant can verify
The stronger ROI cases combine labor with measurable process gains that operations already tracks. Those benefits are often easier to defend because they show up in production records, quality reports, and maintenance logs.
Common examples include:
- Higher throughput: more good units per shift because the station runs with less variation and fewer micro-stops
- Lower scrap and rework: repeatable motion, torque, force, alignment, or dispensing reduces avoidable defects
- Less overtime: output becomes less dependent on a small group of experienced operators
- Safer execution: repetitive or awkward tasks move out of manual handling, which can reduce injury exposure and lost-time disruption
- Better schedule adherence: the line misses fewer shipments because one unstable manual step no longer drives the whole process
Here's a good place to show the idea in action:
For GMP-regulated production, quality and compliance gains can matter as much as labor. Better recipe control, traceability, inspection consistency, and reduced manual intervention may lower deviation risk or batch review burden. Those benefits should still be modeled conservatively. If the team cannot tie them to a current failure mode, recurring deviation, or measurable review effort, they belong in the narrative, not the savings line.
Semi-automation often produces the more believable business case
Full automation can deliver strong returns, but it usually depends on more assumptions. Semi-automation often survives financial review because it targets the unstable, repetitive portion of the work while keeping human judgment where the process still needs flexibility.
That approach tends to produce a cleaner argument. The machine handles repeatable motion and positioning. The operator manages exceptions, confirms quality, and keeps the process moving. Savings are lower on paper than a fully automated concept, but they are often easier to defend because the model matches what the plant will run.
When I build these cases, I would rather show modest first-year gains that the site can beat than aggressive savings that disappear during startup. A realistic automation ROI calculator separates theoretical savings from captured savings, especially for semi-automated systems and GMP environments where intervention, documentation, and controlled change are part of daily operation.
Calculating the Key Financial Metrics That Matter
A plant manager walks into a capital review with a spreadsheet that shows a 14 month payback. The CFO asks two questions. What assumptions drive the number, and what happens if startup slips by a quarter? If the model falls apart under that pressure, the project is not ready.
That is why the financial section has to stay simple enough to audit and strict enough to survive scrutiny.
Start with payback, but make it a payback number you can defend
Payback is usually the first figure leadership looks for because it answers the basic screening question fast. How long until the project returns the cash invested?
The standard formula is straightforward:
| Metric | Formula | Example value |
|---|---|---|
| Total Initial Investment | All upfront project cost | $500,000 |
| Annual Net Benefit | Annual benefit less annual operating burden | $280,000 |
| Payback Period | Investment ÷ Annual Net Benefit × 12 | 21.4 months |
That math is easy. The judgment is harder.
A 21.4 month payback can be acceptable for many manufacturing projects, but only if the annual net benefit reflects what the site will effectively capture after startup losses, operating burden, validation effort, and normal intervention. For semi-automated systems, I often run two versions side by side. One uses theoretical savings. The other uses captured savings after the realization gap. The second number is the one I would put in front of a CFO.
If the project includes a formal factory acceptance test plan for the automation system, include that timing in the cash flow. A good FAT reduces startup risk, but it does not make commissioning free or immediate.
Use four metrics, each for a different approval question
Payback gets the meeting started. It does not finish the case.
A solid automation ROI calculator should report four financial metrics, each tied to a decision someone in the approval chain makes:
Payback period
Best for initial screening and plant-level capital reviews.ROI
Useful for showing return relative to the upfront spend. Keep the formula consistent with your company's standard. Teams lose credibility when ROI means one thing in engineering and another in finance.NPV
Useful when finance wants to compare this project with other capital requests over the full project life, not just the first recovery period.IRR
Useful when the business has a hurdle rate and needs to know whether the project clears it.
These numbers should come from the same cash flow logic. Do not build one optimistic payback sheet and a separate finance model with different assumptions buried in another tab. That is how reviews get delayed.
Build the worksheet so someone else can audit it
The strongest models are usually boring to look at. That is a good sign.
Use one input block, one assumptions block, and one output block. Keep tax treatment, discount rate, project life, and startup timing visible. Separate hard savings from softer benefits. If a benefit cannot be tied to a measured current-state loss, keep it out of the main return calculation and mention it as supporting context.
A practical worksheet usually includes:
Inputs
- Initial investment
- Annual operating cost
- Annual net benefit
- Ramp-up period
- Project life
- Discount rate or finance assumptions
- Validation or compliance timing, if applicable
Outputs
- Payback period
- ROI
- NPV
- IRR
- Sensitivity case, usually base, conservative, and downside
The best calculator is one a controller can trace line by line without asking what a hidden formula is doing.
One more rule matters. If the return only works when every assumption goes right, the project is still weak. A credible model should remain acceptable after lower throughput gains, delayed startup, and partial labor capture are applied. That is usually the difference between an online calculator result and an approval-ready ROI case.
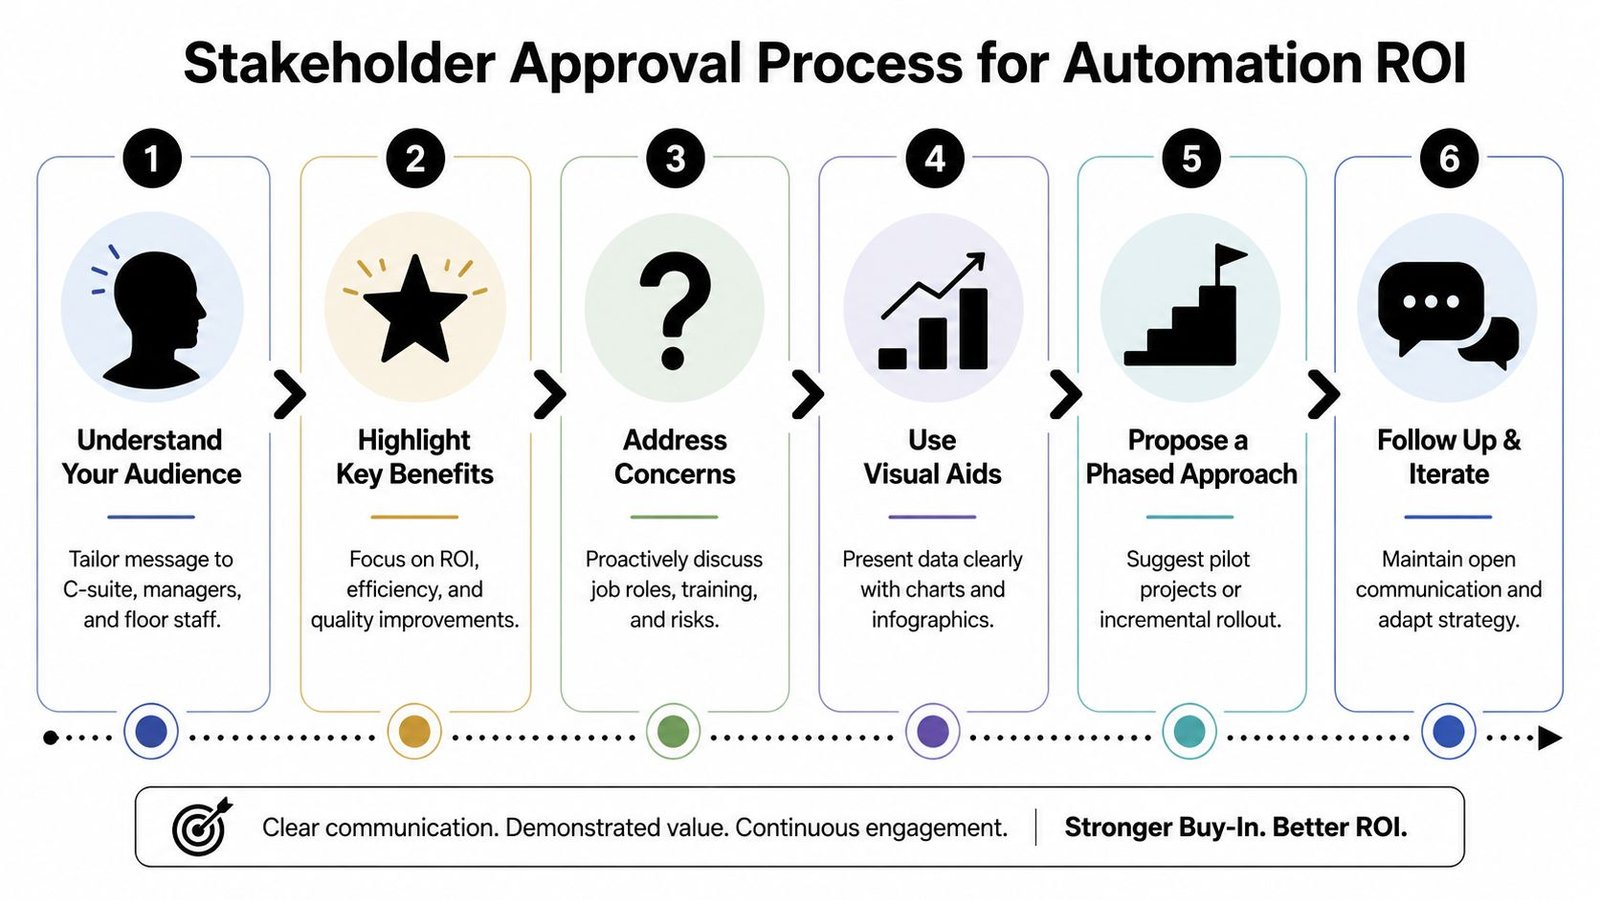
Presenting Your Results for Stakeholder Approval
A good automation ROI calculator is not just a spreadsheet. It's a decision document.
A lot of technically sound projects stall because the presentation doesn't match the audience. Production wants to know whether the process will run. Quality wants control and repeatability. Maintenance wants supportability. The CFO wants to know whether the project improves the business beyond a narrow labor argument.
Speak differently to operations finance and quality
For larger projects, the better financial models move beyond simple return formulas. Emerson's automation ROI guidance uses invested capital and after-tax cash flow concepts, tying automation decisions to capital expenditure, working capital, and operating expense changes. The same guidance reflects why multi-year 5- or 7-year models are now standard for major automation planning.
That matters when you're presenting results. The plant may be focused on a short payback window, but finance often wants to see the broader effect on capital efficiency and ongoing operating performance.
A simple audience split helps:
| Stakeholder | What they care about most |
|---|---|
| Operations manager | Throughput, staffing stability, less firefighting |
| Quality leader | Repeatability, traceability, controlled execution |
| Maintenance | Access, spare parts, troubleshooting burden |
| CFO or finance lead | Payback, cash flow effect, total capital efficiency |
If your project requires formal testing before release, include that readiness in the story. A strong approval package often gets more traction when it shows how acceptance and risk control will be managed through factory acceptance tests.
Use scenarios instead of one perfect forecast
Single-scenario models create argument. Scenario-based models create confidence.
Present at least three views of the same project:
- Conservative case: Lower realization of savings, longer ramp-up, full support burden included.
- Expected case: Your most likely operating result based on current process conditions.
- Upside case: Best credible result if adoption, uptime, and process stability all go well.
This approach solves a common problem in review meetings. Instead of defending one optimistic number, you can show how the project behaves under tougher assumptions.
A CFO doesn't need a promise. A CFO needs to see that the project still makes sense when reality is messy.
A strong presentation also includes the questions that usually come back later:
- What happens if staffing doesn't reduce as quickly as expected?
- What manual work remains after installation?
- What support costs continue annually?
- How long does ramp-up take before steady-state performance is reached?
- What operational risk decreases, even if headcount doesn't?
That last question often matters more than engineers expect. Many approved projects are justified because they remove instability from a critical process, not because they create a dramatic labor cut.
Your Actionable ROI Calculator Template
A useful automation ROI calculator is not a marketing widget. It's a working model built for plant reality.
The reliable version does five things well. It starts with a measured baseline. It captures the full investment, not just the quoted machine price. It projects gains conservatively, especially where people remain in the loop. It calculates financial outputs that both operations and finance can use. And it presents the result in a way that holds up under questioning.
That's the shift that matters. The calculator stops being a math exercise and becomes a justification tool.
What your template should include
If you're building or revising your own spreadsheet, keep the structure practical:
Baseline inputs
- Current labor content
- Maintenance burden
- Rework and correction effort
- Delay and handoff losses
Project cost inputs
- Equipment and integration
- Engineering and installation
- Downtime during implementation
- Training, validation, and support
Benefit inputs
- Labor savings realized
- Throughput improvement
- Quality and consistency gains
- Reduced manual intervention
Financial outputs
- Payback period
- ROI
- NPV
- IRR
- Scenario comparison
Use the model as a decision filter
The best template helps you reject weak projects early. If the numbers only work when every assumption is optimistic, the project probably needs a different scope, a phased rollout, or a lower-risk level of automation.
That's especially true for manufacturers trying to improve production without overcommitting to a fully automated solution on day one. In many plants, a semi-automatic station, custom fixture set, or integrated operator-assist system produces the strongest first ROI because it solves a real bottleneck without forcing too much process change at once.
A disciplined calculator makes that visible. It shows where the value comes from, where the risk sits, and what the business is buying.
If you're building an ROI case for a manufacturing project and want help pressure-testing the assumptions, System Engineering & Automation works with manufacturers to develop practical automation solutions that fit real production goals, budgets, and GMP-aware requirements. Whether you're evaluating a semi-automated station, custom tooling, or a broader line upgrade, the right ROI case starts with an honest look at the process and the right level of automation.