
You can usually spot an unbalanced line before anyone opens a spreadsheet. One station has parts piling up. The next operator is waiting. A supervisor starts moving people around by instinct. Overtime creeps in, output misses the plan, and everyone blames labor, demand, or the machine that “can't keep up.”
Most of the time, the line doesn't need more effort. It needs better work distribution, better station design, and a balancing method that survives real production. That matters even more in Southeast Asia, where many factories run mixed levels of manual work, custom fixtures, legacy equipment, and selective automation rather than greenfield lines built from scratch.
Table of Contents
- Why Unbalanced Production Lines Hurt Your Bottom Line
- Gathering Your Baseline Data and Core Metrics
- Calculating and Designing Your Initial Line Balance
- Optimizing Stations with Tooling and Semi-Automation
- A Case Study in Smart Semi-Automation
- Validating Performance and Driving Continuous Improvement
Why Unbalanced Production Lines Hurt Your Bottom Line
An unbalanced line doesn't only reduce output. It distorts everything around it. Material handlers start feeding the wrong areas first. Team leaders spend the shift firefighting. Operators rush at one station and stand idle at another. Quality often slips because the overloaded station takes shortcuts while the downstream station waits for work.
That's why production line balancing should be treated as an operating discipline, not a classroom exercise. The practical goal is simple: distribute work across stations so the line can meet customer demand at a steady rhythm, without chronic bottlenecks or built-in idle time.
What poor balance looks like in practice
On the floor, the warning signs are usually obvious:
- Recurring queues at one station: WIP builds in the same place every shift.
- Idle downstream labor: Operators wait because the previous process can't release work consistently.
- Frequent labor reshuffling: Supervisors move people mid-shift just to protect output.
- Late shipments and overtime: The line eventually hits the target, but only by adding cost.
- Hidden quality risk: Work gets compressed at the bottleneck and inspection becomes reactive.
A lot of managers respond by asking for another machine, another operator, or another overtime block. Sometimes that's necessary. Often it isn't.
Practical rule: If one station is overloaded and the next is underused, your first move should be work reallocation, not capital spending.
Published case evidence supports that view. One experimental study reported throughput efficiency improving from 70.35% to 96.56% after balancing, showing that the biggest gains often come from shifting work away from bottlenecks and removing idle time rather than adding equipment (experimental line balancing results).
Better balance improves predictability
The immediate value of balancing is not just faster output. It's more predictable output. Once the load across stations is closer to the required pace, planning gets easier, labor pressure drops, and improvement work becomes more honest because the team can finally see the actual constraints.
That's also where broader operational improvement starts. If you're already looking at waste, labor use, and process reliability, this overview of smarter manufacturing operations connects line balance to the larger efficiency picture.
A balanced line won't solve every production problem. It will expose the ones that matter.
Gathering Your Baseline Data and Core Metrics
Most failed balancing efforts have the same root cause. The team started assigning work before they had reliable data. If the task times are weak, the precedence logic is incomplete, or the demand basis is wrong, the new balance will look neat on paper and miss badly in production.
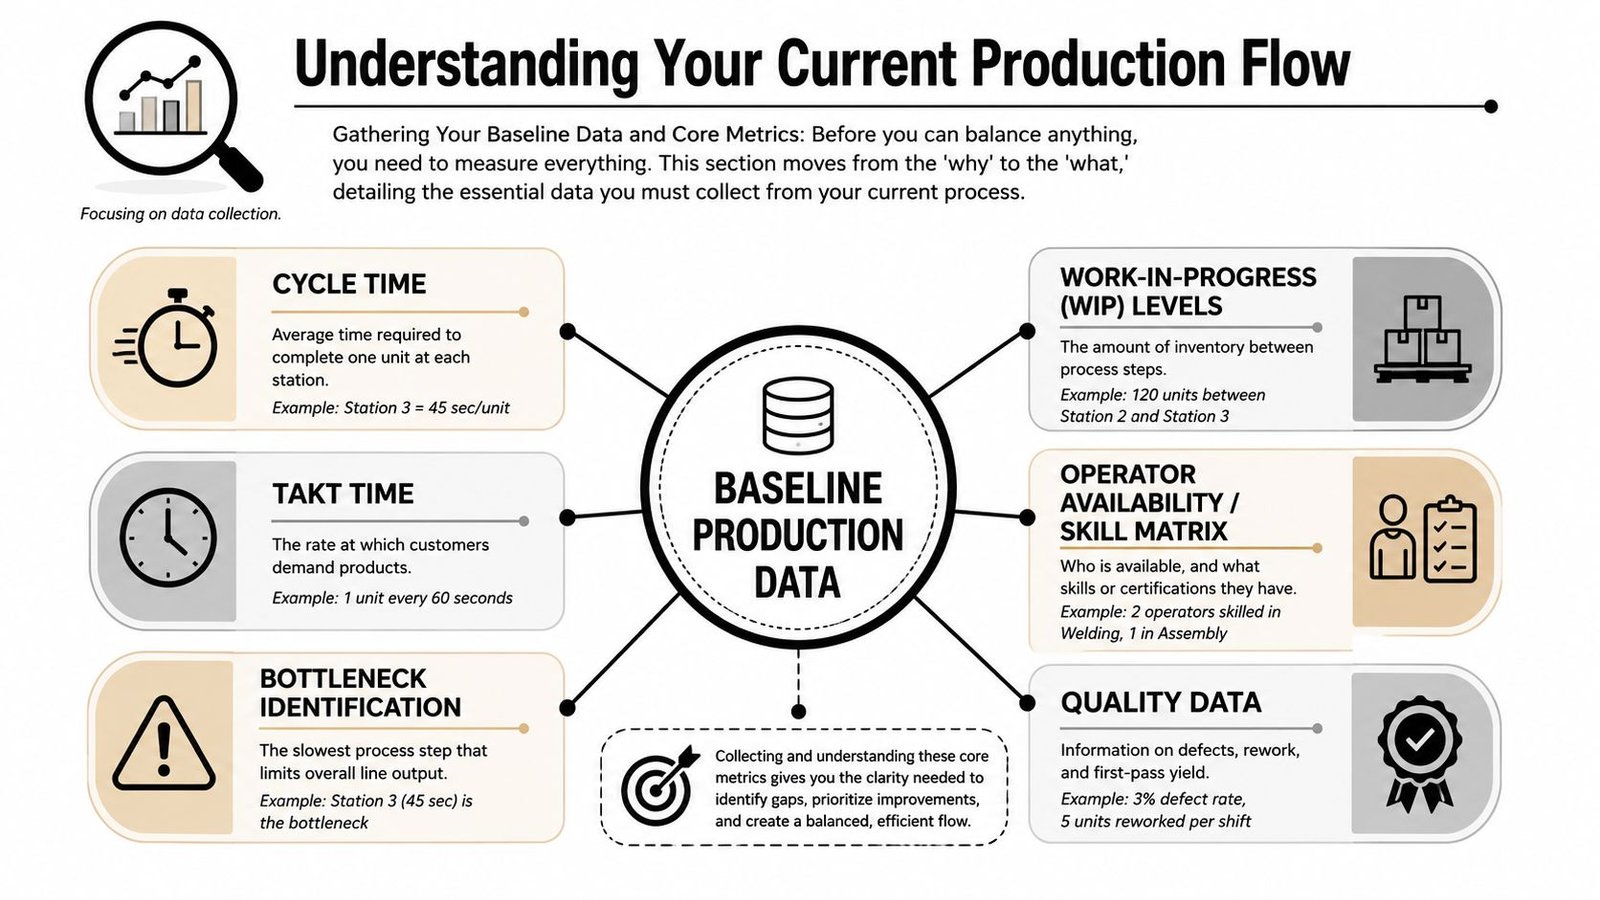
The baseline work has to happen at the machine, at the bench, and at the operator level. Stopwatch studies still matter. Video review is often better because you can replay motion, separate value-added from handling, and challenge assumptions without arguing from memory. Work sampling also helps when the process includes waiting, walking, inspection, or intermittent machine interaction.
What to measure on the floor
A solid baseline usually includes these items:
- Element-level task times: Break each station into real work elements, not broad labels like “assembly” or “inspection.”
- Precedence constraints: Record what must happen before the next task can start.
- Observed waiting time: Separate operator wait, machine wait, and material wait.
- Rework and defects: A station with unstable quality will distort its own cycle time.
- Operator capability: Skill differences matter, especially on mixed manual and semi-automated lines.
- Material presentation: If parts are badly presented, your time study will reflect the layout problem, not only the assembly task.
The three metrics that matter first
Before redesigning anything, the team needs a common language. These three metrics carry most of the discussion.
| Metric | What it means in practice | Why it matters |
|---|---|---|
| Takt time | The production rhythm required to meet customer demand | Sets the pace the line must achieve |
| Cycle time | The actual time a process or station takes to complete its work | Shows whether the station can keep up |
| Total work content | The sum of all task times needed to build one unit | Shows the true labor content that must be allocated |
A practical line-balancing workflow starts by measuring task times through direct observation, video, or work sampling, then mapping precedence constraints before calculating takt time from available production time and customer demand (practical balancing workflow).
Don't average away the pain. If one product variant, one handoff, or one tool change keeps hurting the line, capture it explicitly.
One caution from experience. Teams often collect times from their best operator on a calm day and call it standard. That creates a fragile balance. A usable baseline reflects normal production conditions, normal operators, normal interruptions, and the actual material presentation the line lives with.
If the floor has high mix, frequent changeovers, or operator rotation, baseline collection takes more discipline, not less. That extra effort pays back because it tells you whether the issue is labor content, sequence logic, tooling, or simple workstation design.
Calculating and Designing Your Initial Line Balance
A line can look balanced on paper and still miss output by mid-shift. The usual reason is simple. The task assignment respected the math, but not the way parts, tools, checks, and operators behave at the station.
That is why the first balance should be treated as a production-ready draft, not a finished answer.
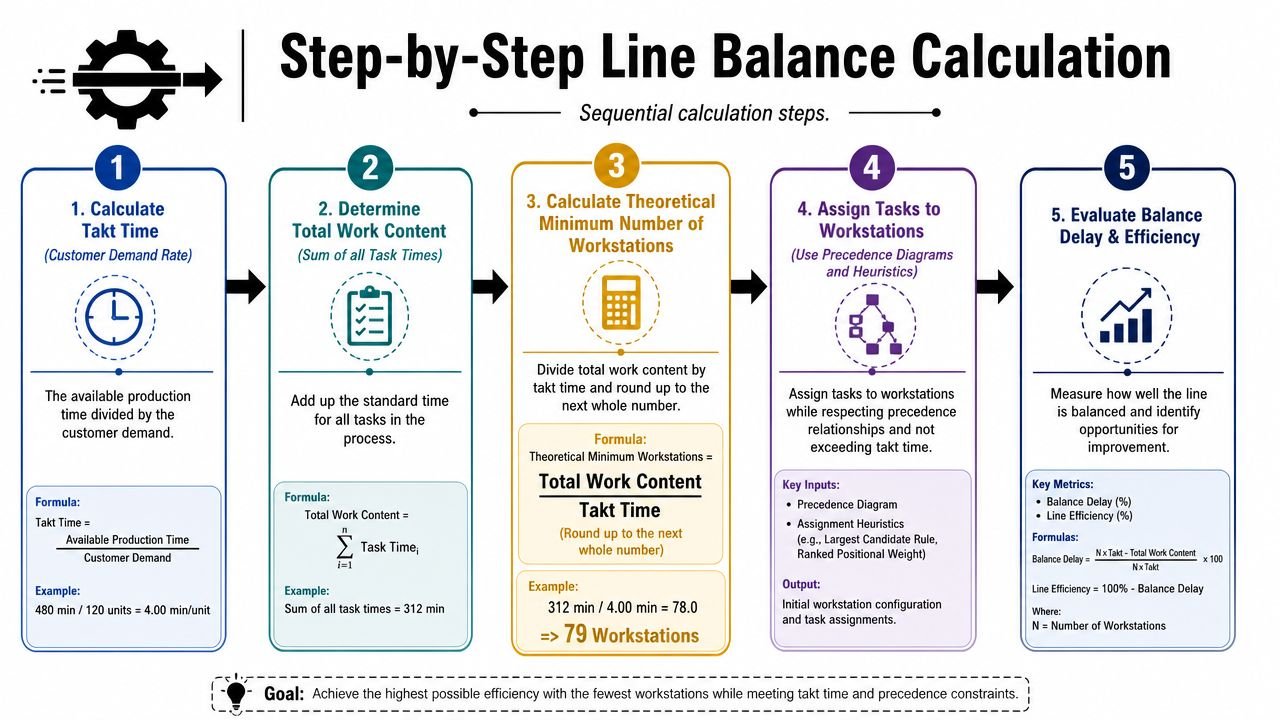
Early in the process, a visual step flow helps keep the team aligned.
Use a simple workflow that matches real practice
Start with the basics. Calculate takt time. Sum total work content. Estimate the theoretical minimum number of stations. Then assign tasks in sequence using a rule the team can explain and repeat, such as an eligibility rule or Ranked Positional Weight.
After that, check the assignment on the floor.
Good line balancing is iterative because the first pass rarely captures shared tools, inspection interruptions, part orientation issues, or operator motion losses. Two stations may look equal by seconds, yet one runs cleanly and the other keeps stalling on clamping, reaching, or regrip. That is where practical engineering judgment matters more than a neat spreadsheet.
A short video can also help align operators, engineers, and supervisors around the logic before you change the floor layout.
A small example you can adapt
Use a simple task list first. It lets the team see the logic before anyone starts debating the exact station layout.
| Task | Task Time (seconds) | Preceding Task(s) |
|---|---|---|
| A | 12 | None |
| B | 18 | A |
| C | 10 | A |
| D | 22 | B |
| E | 14 | B, C |
| F | 16 | D, E |
This gives you a clean starting point:
- Add the task times to get total work content.
- Compare total work content against takt time to estimate the theoretical minimum station count.
- Assign tasks by station while respecting precedence.
The theoretical minimum is only a benchmark. Real lines often need more stations because the process has hard constraints. A quality gate may need separation. A fastening step may require a dedicated tool. A heavy or awkward part may need a different presentation method. In semi-automated lines, a small fixture or poke-yoke device can also change the best task split, which is why custom tooling and fixture design should be considered during balancing, not after the layout is frozen.
How to assign tasks without breaking the flow
Two mistakes show up often in the factory. Engineers load stations by time only and create sequence problems. Supervisors try to equalize every station too tightly and end up with bad handoffs, tool-sharing conflicts, or work content that looks balanced but feels unstable in practice.
A better method is to assign by precedence first, then check each station against physical reality. Ask a few hard questions before you accept the draft:
- Can the operator complete the work in one repeatable sequence?
- Are the needed tools fixed at the station, or will someone wait for a shared resource?
- Does the task grouping create extra walking, turning, or reaching?
- Will in-process checks break the operator rhythm or block downstream flow?
- Would a fixture, jig, or simple semi-automatic assist stabilize the station better than shifting labor between stations?
A station that balances in Excel but drifts on the bench is not balanced.
On actual projects, I prefer to walk the proposed sequence with parts in hand. Dry-run the motions. Check the tool positions. Watch where the operator hesitates. Then re-time the station under normal conditions. That is usually where the first balance improves. The biggest gains often come from small corrections to task grouping, material presentation, and fixture support, especially on lines with manual loading, inspection, fastening, curing, or operator-dependent handling.
Optimizing Stations with Tooling and Semi-Automation
A balanced task chart is only half the job. The station still has to run cleanly, safely, and repeatedly. Many projects frequently stall here. The line has been “balanced,” but operators are still reaching too far, picking from poor locations, waiting for shared tools, or managing tasks that should have been stabilized with a fixture.
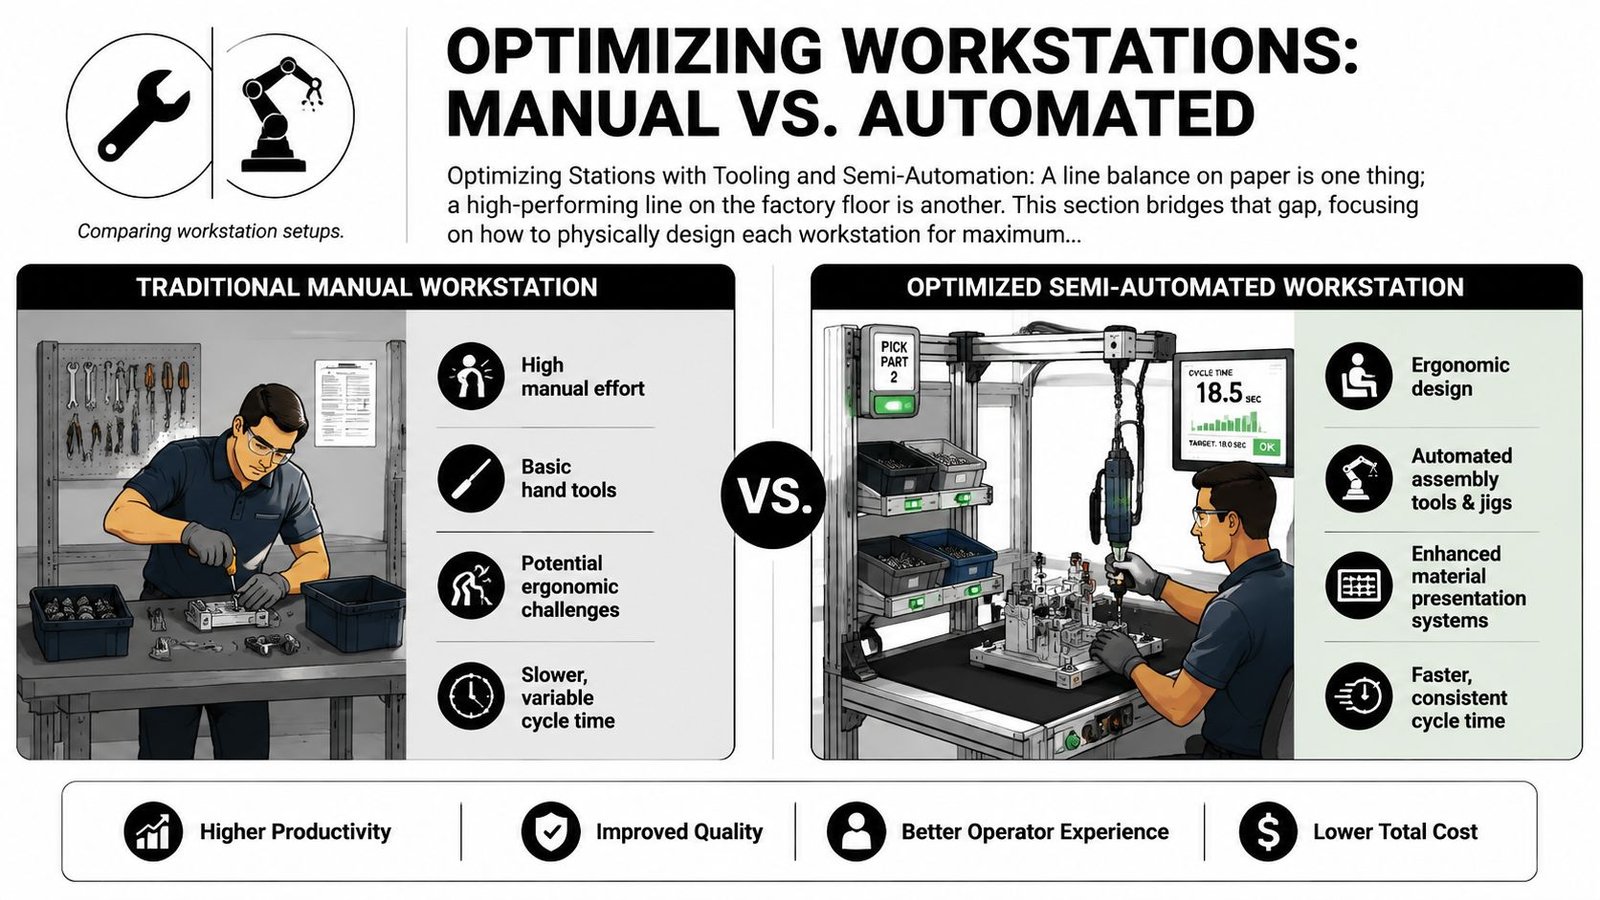
Where manual stations usually fail
Manual stations tend to struggle in familiar ways:
- Too much variation in motion: The operator changes hand path, grip, or sequence from cycle to cycle.
- Weak part presentation: Bins, trays, and components aren't positioned for repeatable work.
- Tool access problems: A screwdriver, press, torque tool, or gauge sits outside the natural work zone.
- Inconsistent clamping or positioning: The product isn't held the same way every time.
- Ergonomic fatigue: The station works for the first hour and degrades by mid-shift.
Those issues don't just slow the task. They also make your original balancing data less reliable because the station time keeps drifting.
When semi-automation makes sense
Full automation gets attention, but in many factories the best return comes from selective upgrades. A pneumatic press, poka-yoke fixture, pick-to-light assist, torque-controlled smart screwdriver, sensor-confirmed nest, or simple indexed mechanism can remove instability without locking the plant into a rigid system.
A useful decision lens looks like this:
| Situation on the station | Better fit |
|---|---|
| Low volume, changing product, skilled manual assembly | Manual with strong fixturing |
| Repetitive task, quality-sensitive step, moderate volume | Semi-automation |
| Stable product, repeatable loading, high labor dependency | Consider fuller automation |
The strongest semi-automation projects usually target one of three problems: repeatability, ergonomic burden, or operator judgment that should be error-proofed.
For manufacturers evaluating fixtures, nests, and station hardware, this overview of custom tooling and fixtures is a useful reference point for what can be improved without rebuilding the whole line.
What regulated manufacturers need to watch
Medical device and other regulated environments need more than speed. The station design must also support controlled assembly, traceable checks, cleanable surfaces where required, and a workflow that doesn't create avoidable contamination or documentation risk.
That changes the tooling conversation. A clever fixture that speeds up assembly but complicates cleaning, validation, or operator verification is a poor trade. In those environments, the best station designs simplify the task while making compliance easier, not harder.
Good semi-automation removes variation from the process. It shouldn't add operational drama.
A Case Study in Smart Semi-Automation
A mid-sized manufacturer had a familiar problem. One assembly station controlled the pace of the entire line. The task required precise part placement, a holding period, and a verification step that depended heavily on one experienced operator. Upstream stations kept feeding work. Downstream stations waited. Supervisors protected output by assigning extra attention to that one point in the process.
The bottleneck was not the whole line
At first glance, the team considered a robot. That would have been the obvious presentation to management because the bottleneck looked technical. It wasn't. The actual issue was that the station relied on manual positioning, variable clamping, and operator feel during a step that needed repeatability.
The line itself didn't need full automation. It needed the station to stop drifting.
A closer review showed three practical constraints:
- The product mix changed often enough that a rigid automated cell would reduce flexibility.
- The problematic work element was concentrated in one repeatable action.
- The operator still added value in loading, inspection, and handling exceptions.
The fix was smaller than expected
The better answer was a targeted semi-automated station. The concept used a custom fixture to locate the part consistently, integrated sensing to confirm proper placement, and a simple actuator to standardize the critical motion. The operator still loaded and unloaded the unit, but the difficult portion of the cycle no longer depended on judgment and hand feel.
That kind of solution usually delivers three practical benefits at once. The station cycle becomes more consistent. Quality checks become more objective. Skilled labor can focus on work that needs human decision-making instead of repeating the same precision motion all day.
The broader lesson is simple. Don't automate the whole line because one station is unstable. Stabilize the station first. Then decide whether more automation is justified.
Validating Performance and Driving Continuous Improvement
Launch day is usually the easy part. The harder test comes a week later, when a different shift is running the line, the product mix changes, one feeder is late, and the station that looked stable during the pilot starts slipping again.
That is why validation has to go beyond headline output. The primary question is whether the new balance holds under normal factory variation, not just during a controlled run with extra attention from engineering and supervisors.
What to verify after launch
Start with direct observation on the floor. Compare actual station times against the design times you used in the balance study. Watch the handoffs, queue points, and waiting losses between stations. A line can hit target output for one hour and still be poorly balanced if operators are catching up through overtime, extra WIP, or informal workarounds.
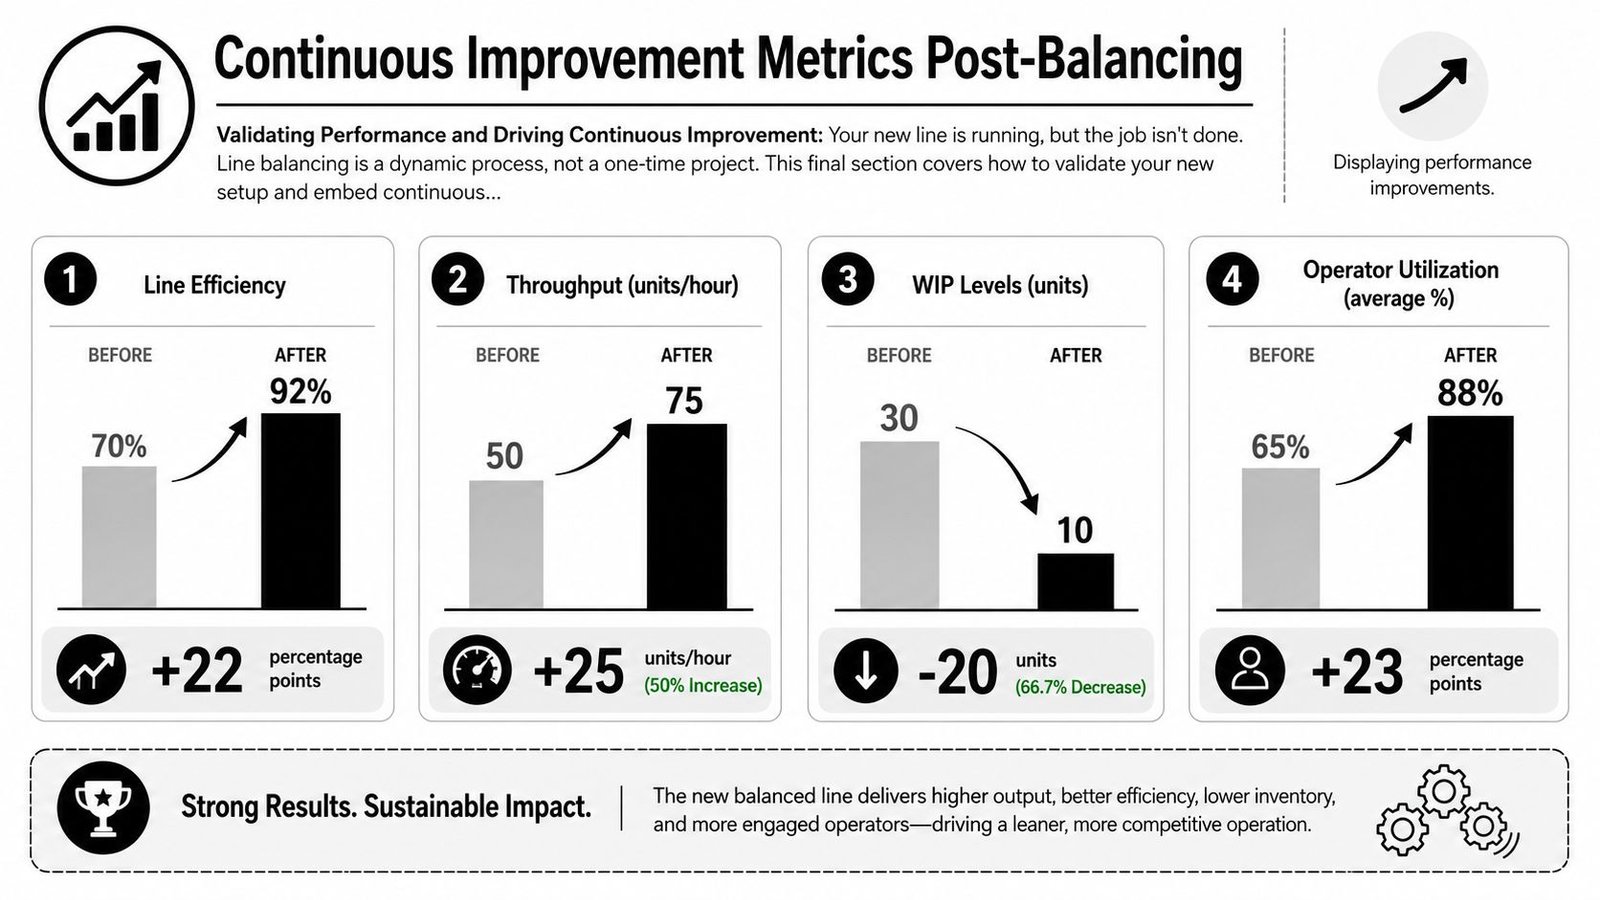
A short validation checklist keeps the review grounded:
- Line efficiency: Recalculate using the actual station time spread after launch, not the planned worksheet.
- Throughput rate: Confirm the line can hold the required pace during normal production, including routine stoppages and operator rotation.
- Cost per unit: Check labor loading, rework, scrap exposure, and whether the new balance is creating hidden overtime.
- Balance stability: See if the bottleneck shifts by model, shift, operator skill level, or incoming material condition.
- Changeover behavior: Verify that output and cycle consistency remain acceptable during batch or model changes.
One caution matters here. If the line only performs when your strongest operator is at the slowest station, the line is not balanced yet. It is being carried.
Why static balancing breaks down in real production
A textbook balance assumes stable task times and predictable flow. Real factories rarely give you that. Tool wear changes effort. Operators rotate. Material presentation varies. Product mix shifts inside the same day. Small losses show up at several stations, then combine into a bottleneck that was not there on paper.
Many improvement projects stall because the team, after finishing the initial balance and seeing a short-term gain, then watches performance drift back as no routine was established for rechecking the assumptions behind the cycle times.
The practical target is not just a balanced line. It is a line you can keep balanced with reasonable effort.
As noted by IMEG in their guide to dynamic line balancing in manufacturing, plants are putting more attention on maintaining balance as conditions change. That matches what happens on the ground, especially in high-mix and semi-automated lines where small variations can move the constraint quickly.
Build routines that keep the line balanced
The best results usually come from simple controls used consistently. Review station cycle loss by shift. Re-time work elements after engineering changes. Update standard work when tooling, fixtures, or part presentation changes. Give team leaders clear rules for when to move labor and when to leave the line alone.
Digital visibility helps, but only if it supports action. For teams that need faster visibility into stoppages, cycle drift, and recurring station losses, machine monitoring software for production performance tracking can support the practical side of dynamic balancing by revealing cycle losses and recurring disruptions earlier.
A line that stays balanced usually has these traits:
- Clear standard work: Each operator follows the same sequence, method, and station boundary.
- Flexible staffing rules: Supervisors know when reassignment reduces waiting time and when it merely shifts the problem.
- Stable fixtures and tools: Repeatability comes from the process, not operator improvisation.
- Routine re-timing: The team checks whether actual work content still matches the original balance assumptions.
- Fast corrective action: Small drifts get fixed before they turn into chronic WIP buildup or missed output.
The best production line balancing work creates a system the plant can maintain, not just a layout that looks good during a pilot.
If your team is trying to balance a manual or semi-automated line, reduce bottlenecks, or decide where smart tooling makes more sense than full automation, System Engineering & Automation can help. SEA designs cost-effective manufacturing solutions that improve throughput, quality, and safety, from custom fixtures and semi-automatic stations to complete engineered systems with installation and commissioning support.