You can usually tell when a line has a throughput problem before the reports catch up. Orders start stacking between two stations. Operators wait on a machine that “should” be faster on paper. Inspection gets blamed, then setup gets blamed, then staffing gets blamed. Meanwhile, the limiting factor keeps setting the pace of the whole line.
That's the situation many plant managers are in right now, especially on semi-automated and manual lines. The equipment is partly automated, the labor is skilled, and the losses aren't always visible in ERP summaries or monthly dashboards. Throughput optimization in that environment isn't about buying the biggest system or chasing abstract lean terminology. It's about finding the exact point where flow breaks, fixing it with the right-sized solution, and making sure the gain sticks.
Table of Contents
- Defining and Measuring Production Throughput
- Diagnosing Your Line to Find Real Bottlenecks
- Prioritizing High-Impact Improvement Levers
- Piloting and Validating Your Optimization Strategy
- Sustaining Gains with Continuous Improvement
Defining and Measuring Production Throughput
At 2:00 p.m., the line looks busy. Operators are moving, machines are cycling, and pallets are stacking up. By the end of the shift, shipments are still short because a portion of that activity never became saleable output.
That is why throughput has to be defined tightly before anyone tries to improve it. For plant managers running semi-automated or manual-heavy lines, the practical question is simple. How many good units left the line in a given period without rework, retest, or scrap-related delay?
Teams often track total output, machine runtime, or labor utilization first. Those numbers have value, but they do not tell you whether the line is converting time into shipped product. They also miss a common problem on mixed manual and automated lines. Human-machine handoffs can slow flow, create waiting, and distort performance without showing up clearly in standard production summaries.
Use the metrics that reflect real output
Start with Throughput Rate. The formula is straightforward. Throughput Rate equals Good Units Produced divided by the Time Period, as defined by this throughput rate reference. Good units matter because they reflect what the process delivered, not what passed through a station.
The next metric is Maximum Throughput. Calculate it as planned operating time divided by theoretical cycle time per unit. Use that number as a ceiling, not a daily target. It helps separate losses caused by equipment, staffing, quality, material flow, or assumptions that were too optimistic from the beginning.
On a semi-automated line, a useful measurement set usually includes:
- Throughput Rate: Good units over the selected time period.
- Maximum Throughput: The upper limit based on planned time and ideal cycle time.
- WIP accumulation: Where material builds up, waits, or disappears.
- Quality-adjusted output: Whether the line is producing saleable units or just activity.
- Shift-level bottleneck cycle time: The floor-level number that usually explains today's shortfall.
Clipboards and end-of-shift recollection are better than guessing, but they are weak tools for improvement. A plant-level machine monitoring software system for line visibility can help capture station behavior without waiting for month-end summaries.
Measure the bottleneck in real time
For day-to-day control, the most useful floor metric is cycle time at the known bottleneck, by shift. That measurement shows whether the line is keeping pace, where orders are waiting, and whether the slowdown is tied to the machine itself or to loading, unloading, inspection, or operator response time around it.
That last point matters more than many teams expect.
On manual and semi-automated lines, the named bottleneck is not always the full story. A press may have a fast cycle on paper, but line output still drops if the operator has to wait for parts, walk to retrieve dunnage, or pause for a downstream quality check. Those are phantom bottlenecks. The machine looks slow, but the loss is happening at the handoff.
A simple operating rule helps. If the team cannot state the current cycle time at the bottleneck and explain the delay around that station, they do not yet know the line's real capacity.
Monthly dashboards still support planning and trend review. They do not help much with same-shift correction. By the time a monthly average shows a loss, the line has already repeated the same problem many times.
Use a short table like this at every shift handoff:
| Metric | Why it matters | Review cadence |
|---|---|---|
| Bottleneck cycle time | Shows current pace of the line | Every shift |
| Good units produced | Confirms effective output | Shift and daily |
| WIP before bottleneck | Reveals starvation or overfeed | Real time or hourly |
| WIP after bottleneck | Reveals downstream blockage | Real time or hourly |
When throughput is measured this way, improvement decisions get sharper. The discussion shifts from broad utilization numbers to the few conditions that change shipped output, especially at the points where people and machines have to stay in sync.
Diagnosing Your Line to Find Real Bottlenecks
A surprising number of throughput projects fail because the diagnosis was wrong. The team saw a queue, assumed the machine beside it was the problem, and spent money there. The line kept underperforming because the actual constraint was somewhere else, or because the visible queue was only a symptom.
Start with the flow, not the dashboard
The best first step is still old-fashioned floor work. Map the process from incoming material to finished output. Use value stream mapping, walk the stations, and mark where work-in-process builds. Don't start in the conference room.
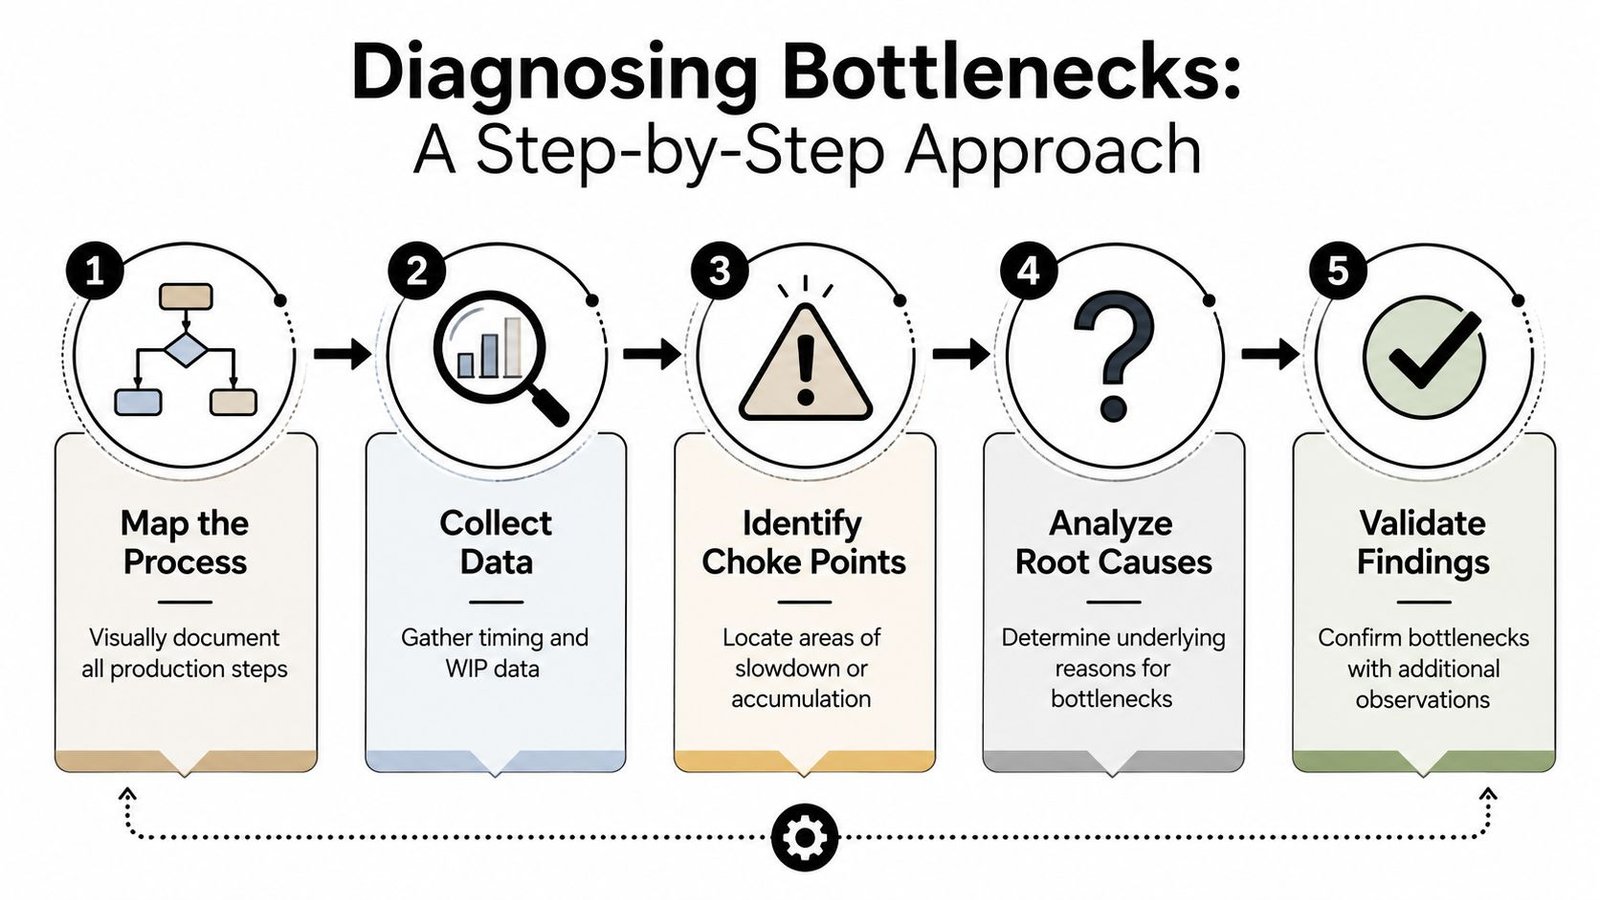
Once the process is mapped, identify the station with the highest active period percentage. Bottleneck-focused improvement methodology treats that station as the pace-setter for the entire line. If one machine is operating at 95% active time while others average 70%, that machine is the clear constraint. Improving non-bottleneck stations first won't raise overall throughput in any meaningful way.
That's also where line balancing enters the conversation. The work content across stations has to align with demand and with the pace of the actual process. If you're planning balancing work across operators and stations, a detailed production line balancing approach helps expose where labor content, machine time, and transfer delays are no longer aligned.
Watch for phantom bottlenecks at handoffs
The most expensive bottleneck on many semi-automated lines isn't a machine at all. It's the handoff between a person and a machine, or between one semi-automated step and the next.
Semi-automated manufacturing lines often suffer from phantom bottlenecks where human-machine handoffs create 20–35% unmeasured throughput loss, and a NIST study found that 68% of mid-sized manufacturers cannot quantify that loss, as noted in this discussion of throughput optimization blind spots. That matters because many ROI models assume the line is losing capacity at the machine, when the actual waste sits in waiting, inconsistent loading, delayed unloading, manual inspection pacing, or part presentation.
Here's what phantom bottlenecks look like in practice:
- Operator pacing drift: One operator loads consistently, another batches parts, and the machine spends time waiting.
- Manual inspection interruption: Parts leave the automated station quickly but queue for a subjective visual check.
- Awkward part handling: The machine cycle is fine, but trays, fixtures, or orientation steps slow the transfer.
- Hidden micro-stoppages: Nobody logs them because each pause is short, but together they steal meaningful capacity.
The line often loses more output between stations than inside the machine cycle itself.
Check the bottleneck before you spend money
Before approving tooling, controls changes, or new automation, verify three conditions on the floor:
- The suspected bottleneck is active most of the time.
- WIP behavior supports the diagnosis. Material should accumulate before the constraint.
- Downstream stations are waiting on it, not blocking it.
A short diagnostic table can keep teams disciplined:
| Observation | Likely meaning | What to do next |
|---|---|---|
| High active time and upstream queue | True bottleneck | Measure its cycle and causes of delay |
| Low active time with queue nearby | Blockage or handoff issue | Check transfer, inspection, release logic |
| Frequent stoppages with poor logs | Hidden loss | Observe manually and classify causes |
| Strong downstream waiting | Upstream constraint | Improve feed stability first |
Teams that do this detective work well usually discover that the fastest ROI comes from fixing the exact point of interruption, not from broad changes across the whole line.
Prioritizing High-Impact Improvement Levers
Once the constraint is clear, the next mistake is easy to make. People jump straight to a large automation concept because it looks decisive. But throughput optimization pays best when the solution matches the actual failure mode.
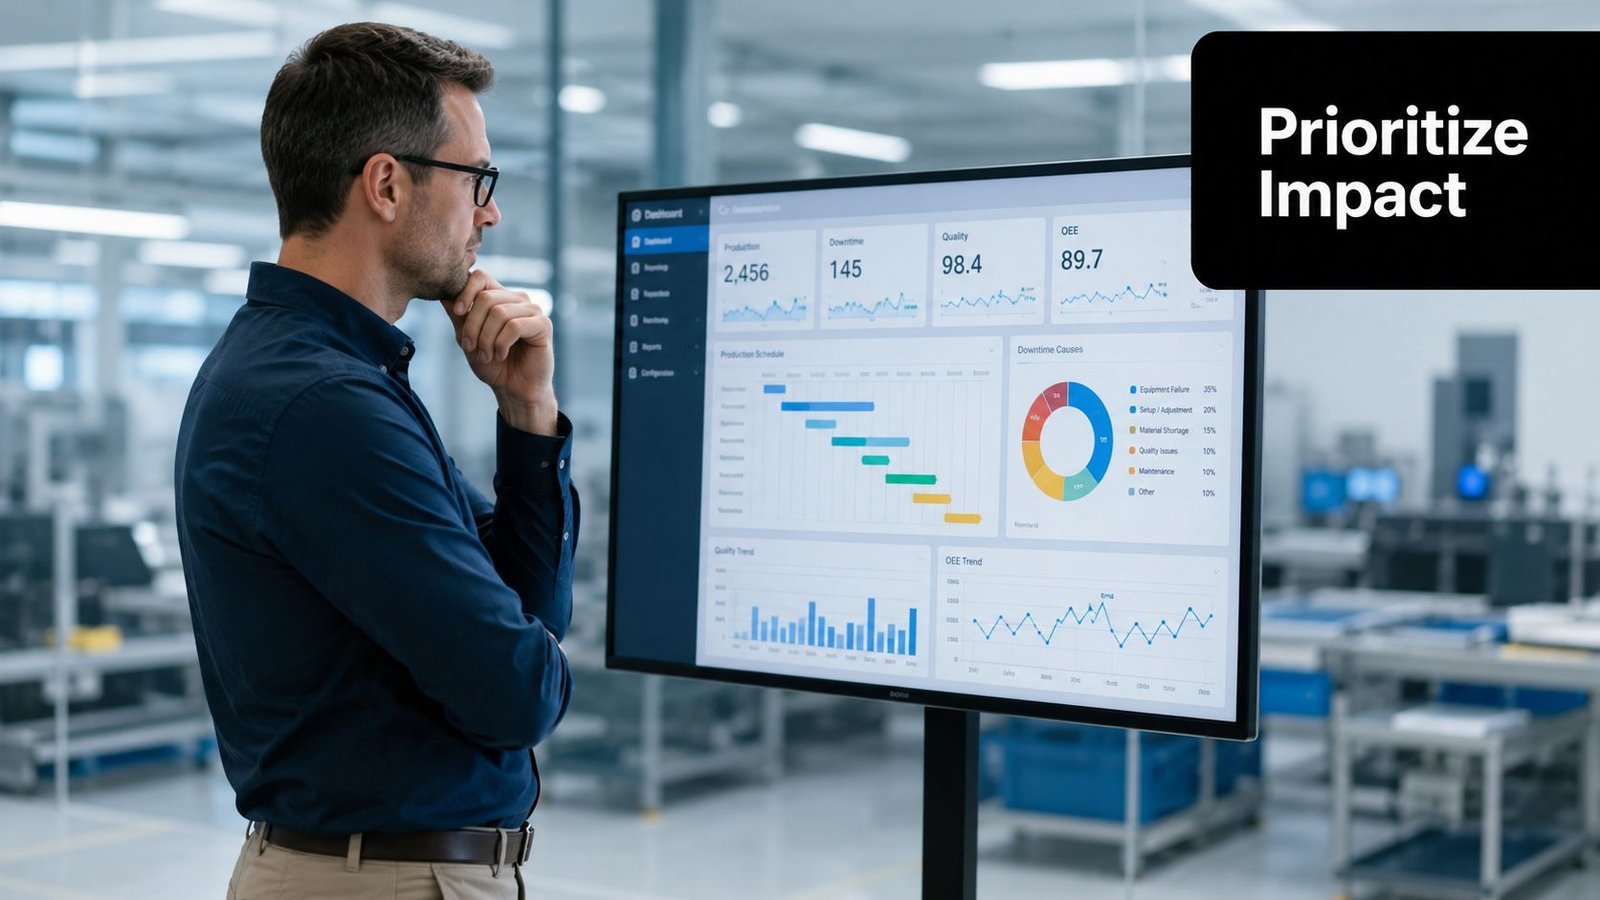
If the bottleneck is part presentation, don't start with a fully automated cell. If the bottleneck is manual transfer consistency, don't lead with a plant-wide software initiative. Match the fix to the loss.
Choose the fix that changes line flow
The most reliable levers usually sit in four buckets. They are not equal, and they should not be funded in the same order on every line.
- Line balancing: When one station carries more work than the rest, balancing can raise flow without adding hardware. Line balancing requires calculating Takt Time to distribute work evenly and eliminate bottlenecks. If that work isn't done, non-bottleneck stations sit idle and OEE drops because OEE is the product of Availability, Performance, and Quality.
- Tooling and fixtures: A custom nest, locator, guide, or quick-load fixture often removes handling variation faster than a larger machine upgrade.
- Controls and PLC improvements: These pay off when sequence timing, interlocks, or sensor logic create unnecessary waiting.
- Layout changes: Reducing travel, reach, turning, and transport distance can matter more than another servo axis.
The practical question is not “what's the most advanced option?” It's “what removes the most waiting at the constraint with the least added complexity?”
Right-sized automation beats overbuilt automation when the goal is ROI, flexibility, and stable output.
A practical way to compare options
A simple comparison framework helps keep projects grounded:
| Improvement lever | Best use case | Common mistake |
|---|---|---|
| Line balancing | Uneven work content across stations | Balancing around averages instead of real bottleneck pace |
| Tooling and fixtures | Inconsistent part handling or positioning | Underestimating how much manual motion affects output |
| Controls upgrade | Sequence delays, poor synchronization | Adding logic without fixing the physical handoff |
| Full automation step | Repetitive, stable, high-volume constraint | Automating a process that still has upstream variation |
In consulting work, the best-performing projects usually share one trait. The team resists the urge to solve everything at once. They pick the lever that attacks the bottleneck directly, then validate the result before expanding scope.
If you're comparing whether a fixture upgrade, semi-automated station, or larger capital project makes sense, an automation ROI calculator is useful for structuring the decision around line impact rather than equipment appeal.
What usually doesn't work:
- Spreading budget across multiple minor changes on non-constraints.
- Buying speed where consistency is the problem.
- Adding automation to a bad layout.
- Ignoring operator interaction in a semi-automated process.
What does work is narrower. Improve the bottleneck. Stabilize the handoff into it. Protect quality. Then decide whether the next gain needs more equipment or just better engineering around the process already in place.
Piloting and Validating Your Optimization Strategy
The cleanest way to reduce project risk is to pilot the change where the line is already telling you the truth. Don't launch full scale on assumptions. Run a controlled test on the bottleneck, collect shift-level data, and let the result make the business case.
Run a pilot that isolates cause and effect
A good pilot usually starts small. One revised fixture. One station sequence change. One material presentation method. One inspection workflow adjustment. Keep the rest of the process as stable as possible so the line team can see whether the change improves flow.
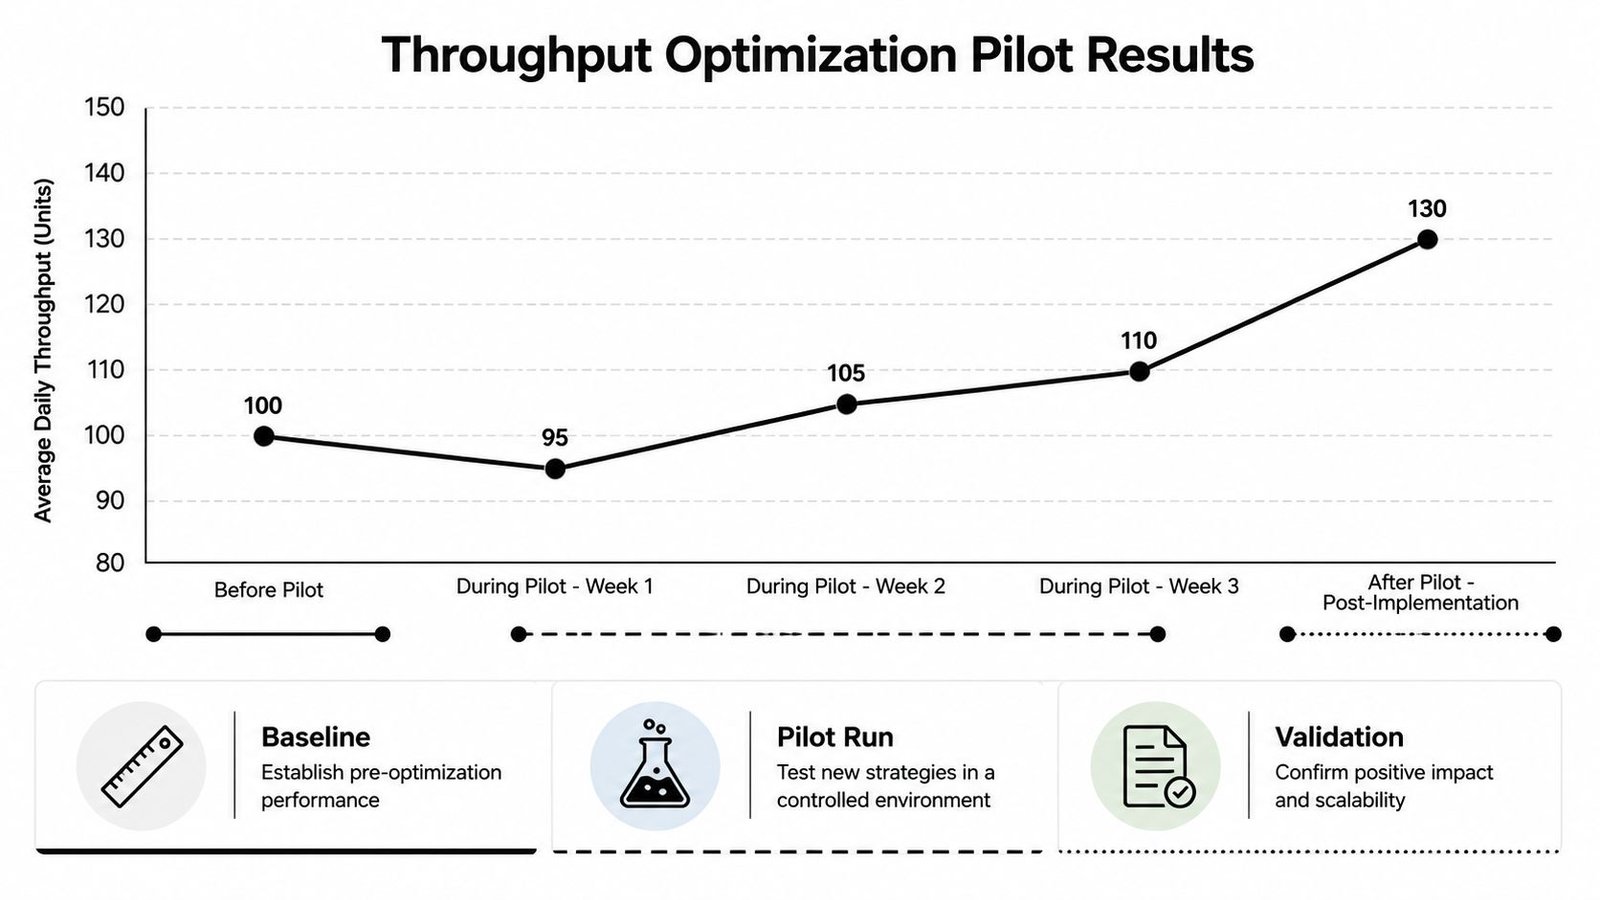
The pilot should track a short list of floor-level measures:
- Cycle time at the bottleneck every shift: This is the most direct proof of whether the change affects throughput.
- Good units produced: Improvement that creates defects isn't improvement.
- Operator observations: If the fix is awkward, difficult to reset, or easy to bypass, the gain won't last.
- WIP behavior around the station: Queues often show whether the constraint moved or disappeared.
A key step in diagnosing throughput issues is tracking cycle time at the known bottleneck every shift, because that real-time view identifies where orders wait and where inspection accumulates more effectively than monthly dashboards, according to this discussion of lean manufacturing metrics.
Validate with the line team, not spreadsheets alone
A pilot passes when two things happen. The numbers improve, and the process becomes easier to run repeatedly.
That second point gets overlooked. A test can look promising during engineering support hours and fall apart when the regular crew owns it. Validation means the setup is practical, the work sequence is teachable, and maintenance can support it without heroic effort.
A pilot should prove more than performance. It should prove repeatability.
Use a simple review after each pilot phase:
| Question | Why it matters |
|---|---|
| Did the bottleneck cycle improve consistently? | Confirms the change affected the true constraint |
| Did quality stay stable? | Protects against false gains |
| Did WIP patterns improve? | Shows whether flow actually got better |
| Did operators accept the change? | Indicates whether the result can scale |
The strongest pilot reports are not flashy. They are clear, disciplined, and tied to the exact station where the line was losing output. That's what gives plant leadership enough confidence to move from trial to implementation.
Sustaining Gains with Continuous Improvement
Monday starts with the same complaint. Output looked good during the pilot, but by the second week the line is missing plan again. The machine settings are still in place, yet WIP is stacking between the manual load station and the next automated step because operators have drifted back to the old handoff sequence and maintenance is clearing the same minor fault three times a shift.
That is how throughput gains disappear on semi-automated lines. The loss rarely comes from one big failure. It comes from small departures at the human-machine handoff that no one treats as a line-stopping issue until weekly output slips.
Lock in the new standard
Sustaining gains starts with making the improved method the only accepted method. If the line now depends on a different part presentation, a fixture confirmation, or a revised response to a sensor fault, that needs to show up in the documents people use on the floor. Update standard work, setup sheets, inspection prompts, escalation rules, and PM checks to match the process you expect to run.
Training has to be tied to actual station behavior, not a generic walkthrough. Operators need to see the target cycle, the normal queue at the station, the first signs of drift, and the exact point where they should call for support. Supervisors need the same clarity so they do not push for output by allowing workarounds that slow the line an hour later.
A sustainment routine usually includes:
- Current standard work: Reflect the revised sequence, timing, and checks.
- Shift-start verification: Confirm the bottleneck station and upstream handoff are ready to run at the expected pace.
- Clear escalation triggers: Define what happens when cycle time drifts, faults repeat, or WIP starts to build.
- Role ownership: Assign response actions to production, maintenance, quality, and engineering.
Plants that keep their gains make one point clear. Temporary workaround equals permanent throughput loss if it becomes normal.
Tie maintenance to flow, not just uptime
Maintenance teams often inherit the line after improvement work is finished, so their routines decide whether the gain lasts. A station can show good uptime on paper and still starve the bottleneck if a worn stop, drifting sensor, sticky cylinder, or recurring micro-jam adds five seconds at every handoff. Those losses are easy to miss because no single event looks serious.
Treat those problems as flow issues first and equipment issues second. Track repeat faults at the bottleneck and the stations feeding it. Then connect the failure pattern to a specific maintenance action, a controls adjustment, or a fixture change. That approach matters more than adding complexity for its own sake.
For regulated production, stable flow also protects compliance. A line that runs predictably is easier to schedule, easier to document, and less likely to invite rushed inspections or deferred checks when output falls behind.
Maintenance should protect the line rate at the constraint.
Use a simple sustainment loop:
- Watch the bottleneck and its handoffs in real time.
- Sort losses by cause: wear, setup variation, operator interaction, controls timing, or downstream blockage.
- Act on repeat patterns early: before the crew starts treating them as part of the job.
- Update the standard: PM tasks, response guides, spare parts, and controls logic should reflect what the line taught you.
Keep improving without overbuilding
Continuous improvement works best when the plant reviews throughput as a changing system. On manual and semi-automated lines, the constraint can shift from a machine cycle to a manual load task, from an inspection step to a carton change, or from equipment uptime to the way parts are presented to the operator. That is why station-level review matters. Summary reports often hide the short stoppages and human delays that cut real output.
The long-term pattern is usually straightforward:
| Stage | What it looks like |
|---|---|
| Stabilize | Remove chronic interruption, reduce variation, standardize the method |
| Control | Track the bottleneck, define response actions, support the station with maintenance |
| Improve | Add targeted tooling, sequence changes, or automation where the loss is proven |
| Recheck | Review flow again because the bottleneck may have moved |
The best plants stay disciplined here. They do not assume more automation is the answer because one project paid back well. Extra sensors, more logic, or a larger machine can help, but only if they remove a measured source of lost flow and the floor team can support them every day. On many lines, a right-sized semi-automatic fixture, a better part presentation method, or a cleaner handoff signal produces better ROI than a larger fully automated system that is harder to maintain and slower to change over.
The goal is sustained output, not a technically impressive install.
The best throughput work holds up under normal staffing, normal maintenance support, and normal production pressure. Standardize the improved method. Protect the bottleneck with practical maintenance. Recheck the handoffs where hidden delay returns first. That is how plants keep the gain instead of winning it twice.